| __timestamp | Allegion plc | Global Payments Inc. |
|---|---|---|
| Wednesday, January 1, 2014 | 853700000 | 1751611000 |
| Thursday, January 1, 2015 | 869100000 | 1750511000 |
| Friday, January 1, 2016 | 985300000 | 1767444000 |
| Sunday, January 1, 2017 | 1070700000 | 2047126000 |
| Monday, January 1, 2018 | 1173300000 | 2271352000 |
| Tuesday, January 1, 2019 | 1252300000 | 2838089000 |
| Wednesday, January 1, 2020 | 1178800000 | 3772831000 |
| Friday, January 1, 2021 | 1204900000 | 4750037000 |
| Saturday, January 1, 2022 | 1322400000 | 5196898000 |
| Sunday, January 1, 2023 | 1581500000 | 5926898000 |
| Monday, January 1, 2024 | 1668500000 | 6345778000 |
Unlocking the unknown
In the ever-evolving landscape of financial performance, Global Payments Inc. and Allegion plc have showcased remarkable growth in gross profit over the past decade. From 2014 to 2023, Global Payments Inc. has seen its gross profit soar by approximately 238%, starting from $1.75 billion to an impressive $5.93 billion. This growth trajectory highlights the company's strategic prowess in capturing market share and optimizing operations.
On the other hand, Allegion plc, while more modest in its growth, has demonstrated a steady increase of around 85% in the same period, rising from $853 million to $1.58 billion. This consistent performance underscores Allegion's resilience and ability to adapt in a competitive market.
As we delve into these figures, it's clear that both companies have navigated the financial tides with distinct strategies, offering valuable insights into their operational efficiencies and market positioning.
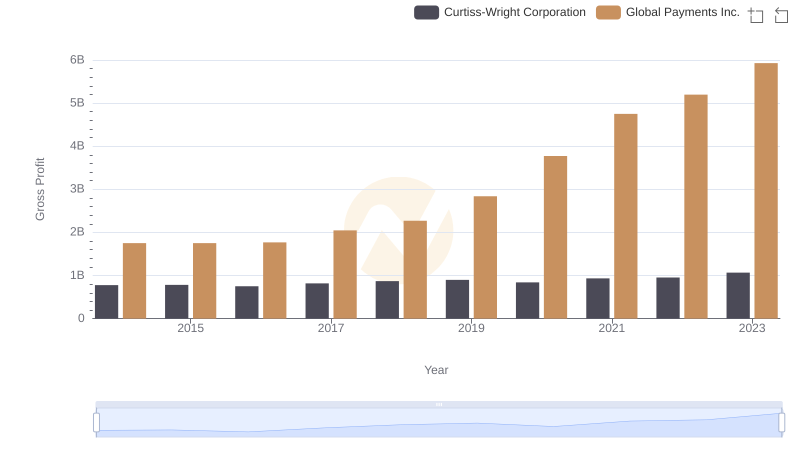
Global Payments Inc. vs Curtiss-Wright Corporation: A Gross Profit Performance Breakdown
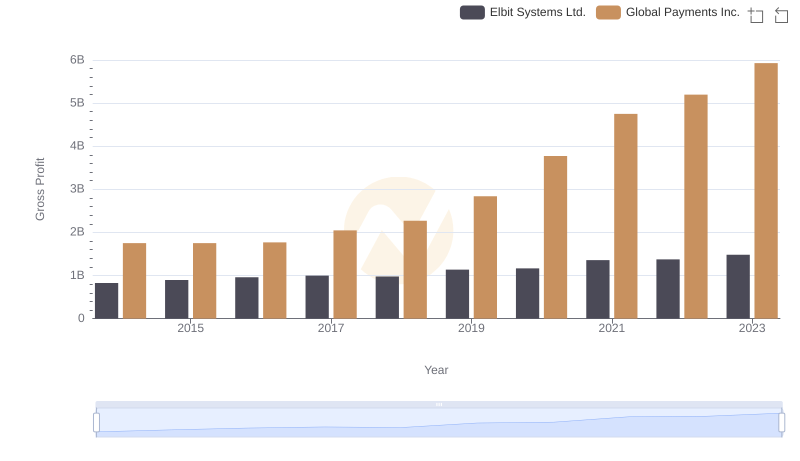
Gross Profit Analysis: Comparing Global Payments Inc. and Elbit Systems Ltd.
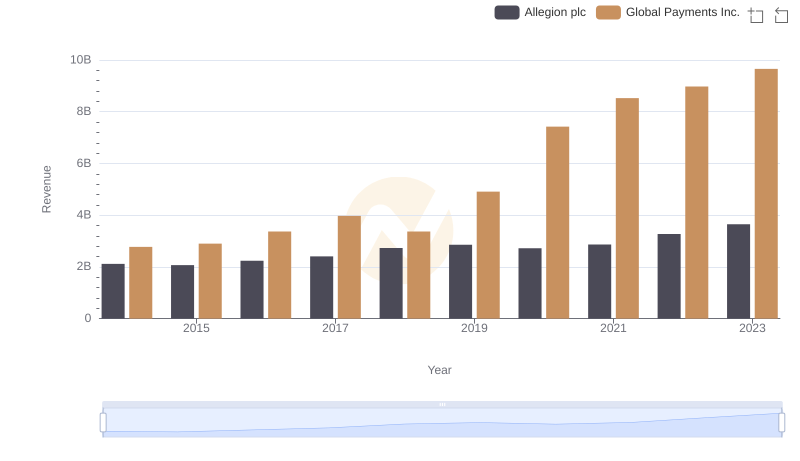
Global Payments Inc. vs Allegion plc: Examining Key Revenue Metrics
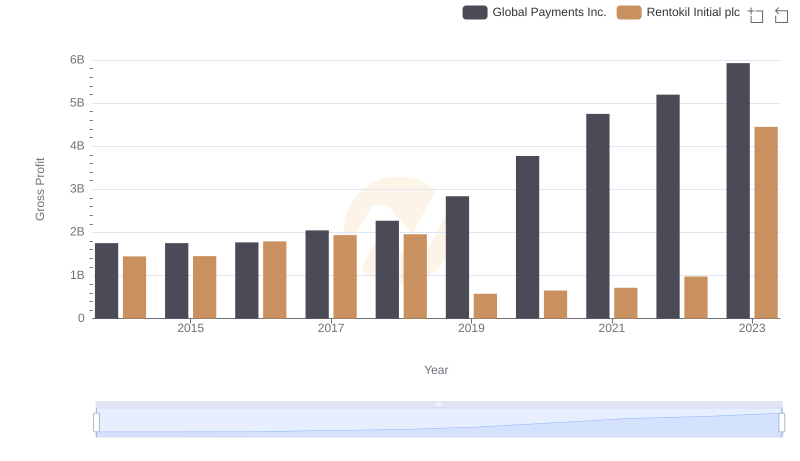
Global Payments Inc. vs Rentokil Initial plc: A Gross Profit Performance Breakdown
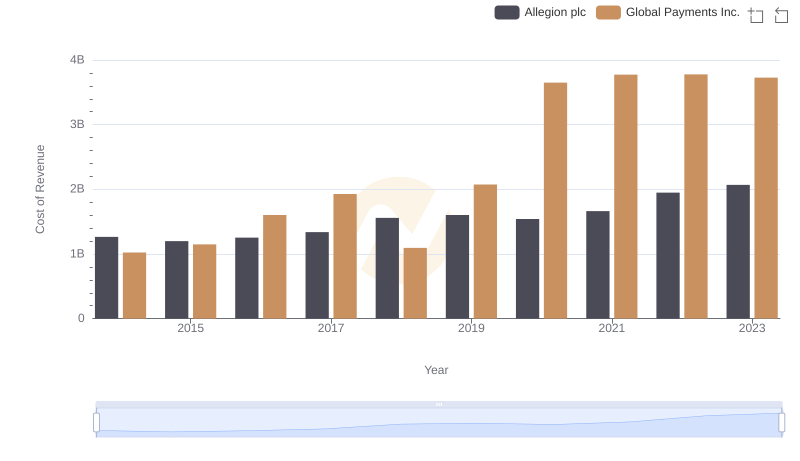
Cost of Revenue Trends: Global Payments Inc. vs Allegion plc
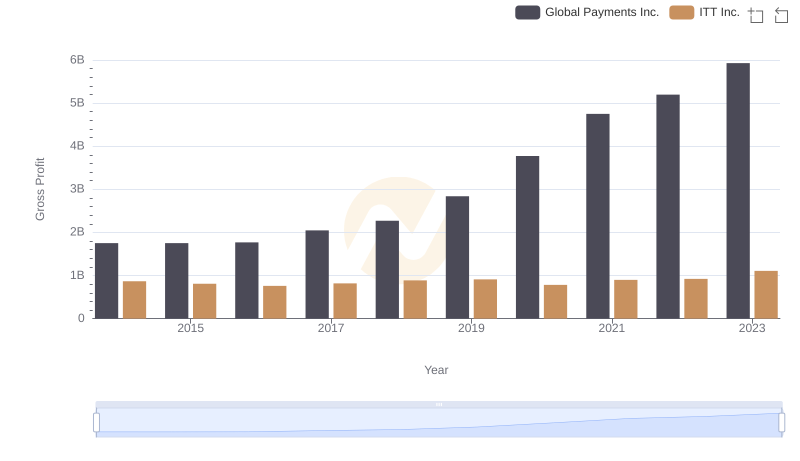
Who Generates Higher Gross Profit? Global Payments Inc. or ITT Inc.
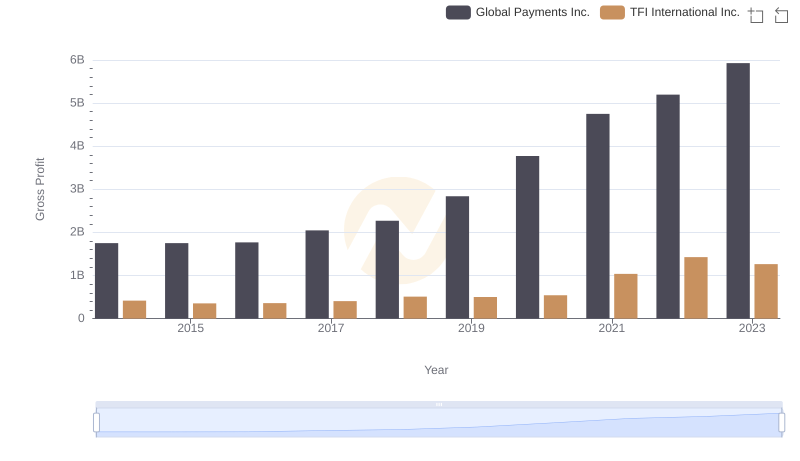
Gross Profit Comparison: Global Payments Inc. and TFI International Inc. Trends