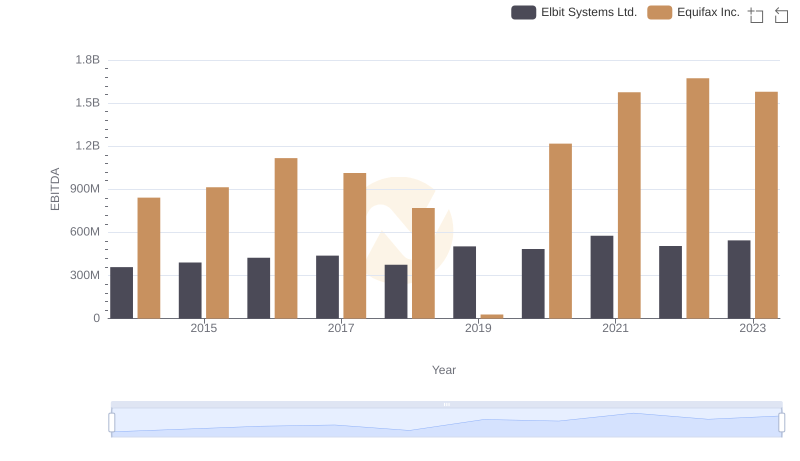
| __timestamp | Equifax Inc. | TFI International Inc. |
|---|---|---|
| Wednesday, January 1, 2014 | 842400000 | 334908602 |
| Thursday, January 1, 2015 | 914600000 | 314924803 |
| Friday, January 1, 2016 | 1116900000 | 325584405 |
| Sunday, January 1, 2017 | 1013900000 | 517899005 |
| Monday, January 1, 2018 | 770200000 | 521265317 |
| Tuesday, January 1, 2019 | 29000000 | 674440000 |
| Wednesday, January 1, 2020 | 1217800000 | 709296000 |
| Friday, January 1, 2021 | 1575200000 | 1358717000 |
| Saturday, January 1, 2022 | 1672800000 | 1561728000 |
| Sunday, January 1, 2023 | 1579100000 | 1194213000 |
| Monday, January 1, 2024 | 1251200000 |
Infusing magic into the data realm
In the ever-evolving landscape of global business, understanding the financial health of companies is crucial. This analysis delves into the EBITDA performance of Equifax Inc. and TFI International Inc. from 2014 to 2023. Over this period, Equifax Inc. demonstrated a robust growth trajectory, with its EBITDA peaking in 2022 at approximately 1.67 billion, marking a 98% increase from 2014. Meanwhile, TFI International Inc. showcased an impressive upward trend, with its EBITDA surging by nearly 366% over the same period, reaching around 1.56 billion in 2022. Notably, 2019 was a challenging year for Equifax, with a significant dip, while TFI International maintained steady growth. This side-by-side analysis highlights the resilience and strategic prowess of these industry giants, offering valuable insights for investors and stakeholders alike.
Explore the dynamic EBITDA trends of Equifax and TFI International over the past decade.