| __timestamp | AMETEK, Inc. | Union Pacific Corporation |
|---|---|---|
| Wednesday, January 1, 2014 | 1023344000 | 10808000000 |
| Thursday, January 1, 2015 | 1093776000 | 10290000000 |
| Friday, January 1, 2016 | 1007213000 | 9502000000 |
| Sunday, January 1, 2017 | 1068174000 | 10456000000 |
| Monday, January 1, 2018 | 1269415000 | 10802000000 |
| Tuesday, January 1, 2019 | 1411422000 | 11013000000 |
| Wednesday, January 1, 2020 | 1283159000 | 10331000000 |
| Friday, January 1, 2021 | 1600782000 | 11843000000 |
| Saturday, January 1, 2022 | 1820119000 | 12636000000 |
| Sunday, January 1, 2023 | 2025843000 | 11928000000 |
| Monday, January 1, 2024 | 1779562000 | 12461000000 |
Unleashing insights
In the ever-evolving landscape of American industry, Union Pacific Corporation and AMETEK, Inc. have demonstrated remarkable EBITDA growth over the past decade. From 2014 to 2023, Union Pacific's EBITDA surged by approximately 10%, peaking in 2022 with a 15% increase from its 2016 low. Meanwhile, AMETEK's EBITDA skyrocketed by nearly 98% during the same period, showcasing its robust expansion strategy.
Union Pacific, a titan in the transportation sector, consistently maintained an EBITDA over $10 billion, reflecting its resilience and operational efficiency. In contrast, AMETEK, a leader in electronic instruments, saw its EBITDA grow from just over $1 billion in 2014 to over $2 billion in 2023, highlighting its aggressive growth trajectory.
While 2024 data for AMETEK is missing, Union Pacific continues its upward trend, projecting a promising future for both companies.

Comparing Revenue Performance: Union Pacific Corporation or AMETEK, Inc.?
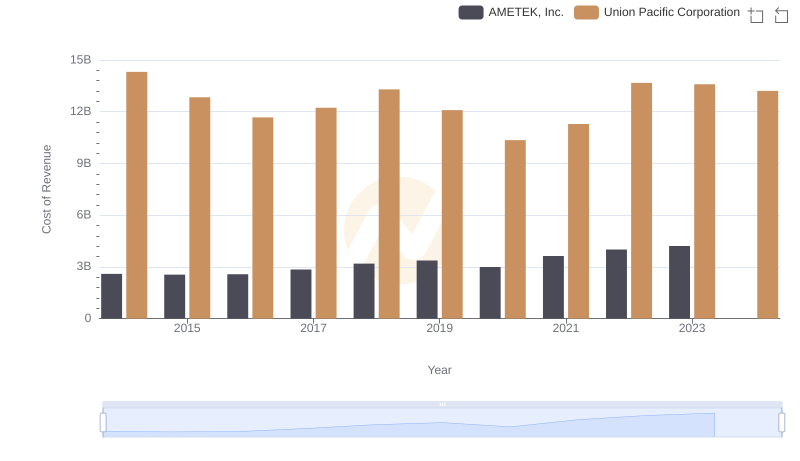
Analyzing Cost of Revenue: Union Pacific Corporation and AMETEK, Inc.
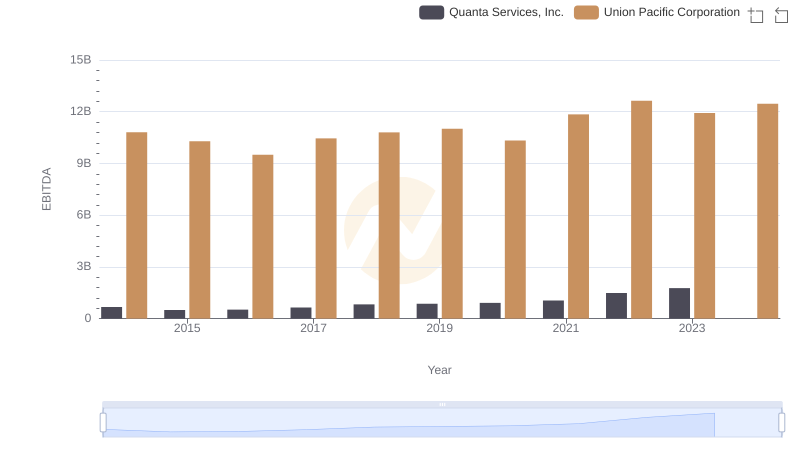
A Side-by-Side Analysis of EBITDA: Union Pacific Corporation and Quanta Services, Inc.
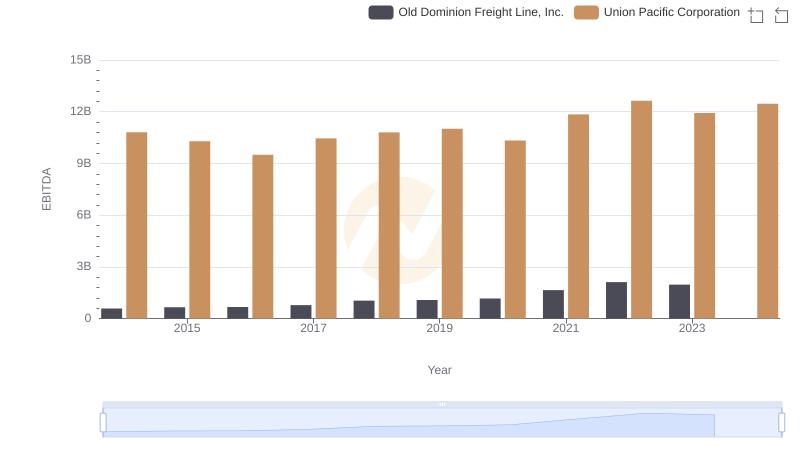
EBITDA Analysis: Evaluating Union Pacific Corporation Against Old Dominion Freight Line, Inc.

EBITDA Metrics Evaluated: Union Pacific Corporation vs Ferguson plc
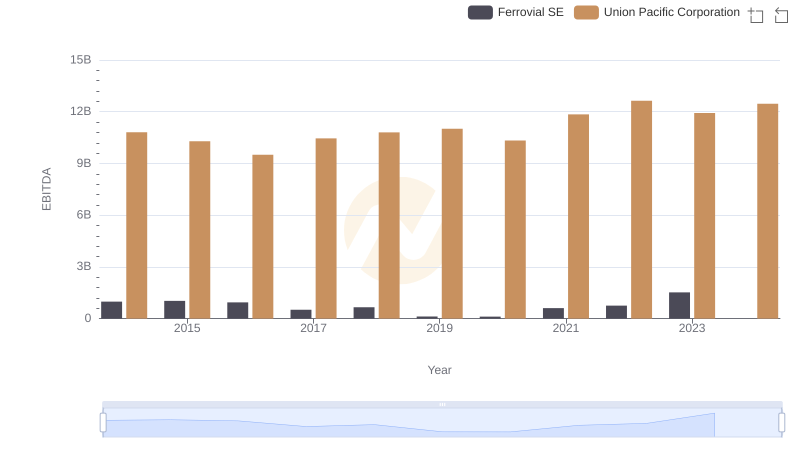
Union Pacific Corporation and Ferrovial SE: A Detailed Examination of EBITDA Performance