| __timestamp | Ferguson plc | Union Pacific Corporation |
|---|---|---|
| Wednesday, January 1, 2014 | 1450623023 | 10808000000 |
| Thursday, January 1, 2015 | 1500920522 | 10290000000 |
| Friday, January 1, 2016 | 1289082542 | 9502000000 |
| Sunday, January 1, 2017 | 1746753588 | 10456000000 |
| Monday, January 1, 2018 | 1487000000 | 10802000000 |
| Tuesday, January 1, 2019 | 1707000000 | 11013000000 |
| Wednesday, January 1, 2020 | 1979000000 | 10331000000 |
| Friday, January 1, 2021 | 2248000000 | 11843000000 |
| Saturday, January 1, 2022 | 3120000000 | 12636000000 |
| Sunday, January 1, 2023 | 3097000000 | 11928000000 |
| Monday, January 1, 2024 | 2978000000 | 12461000000 |
Igniting the spark of knowledge
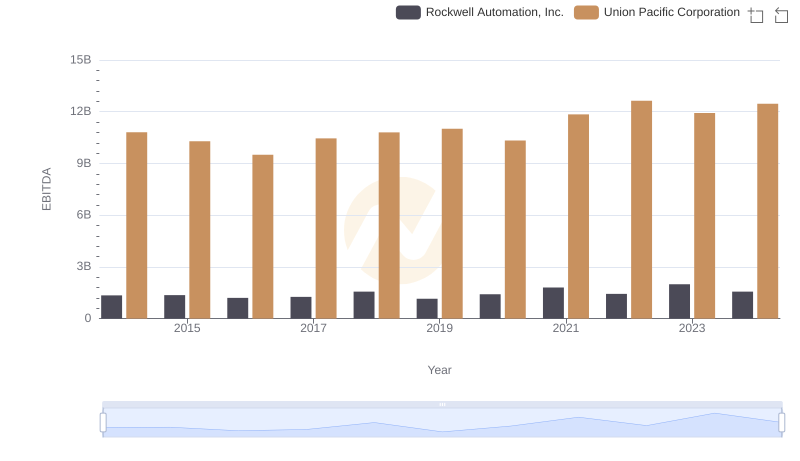
In the ever-evolving landscape of global business, understanding financial health is paramount. This analysis delves into the EBITDA performance of two industry giants: Union Pacific Corporation and Ferguson plc, from 2014 to 2024.
Union Pacific Corporation, a stalwart in the transportation sector, consistently outperformed Ferguson plc, a leader in the building materials industry, with EBITDA figures averaging around 11 billion annually. Notably, Union Pacific's EBITDA peaked in 2022, showcasing a robust 33% increase from its 2016 low. Meanwhile, Ferguson plc demonstrated impressive growth, with its EBITDA nearly doubling from 2014 to 2022, reflecting a strategic expansion and market adaptation.
This decade-long financial journey highlights the resilience and strategic prowess of these corporations, offering valuable insights for investors and industry analysts alike.

Revenue Insights: Union Pacific Corporation and Ferguson plc Performance Compared
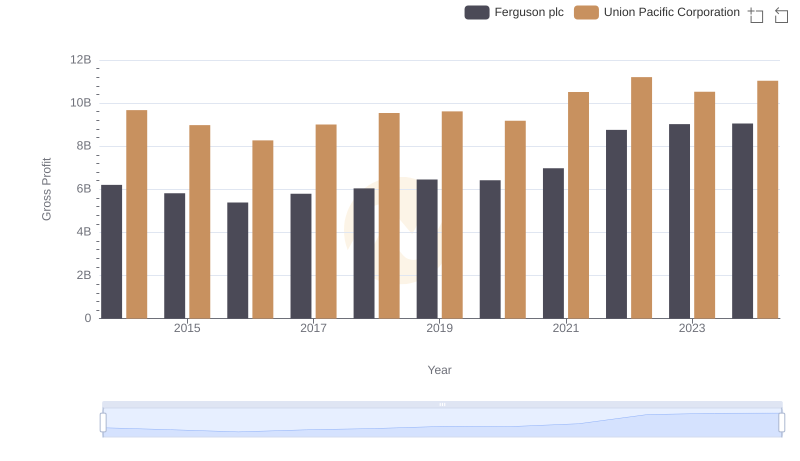
Union Pacific Corporation vs Ferguson plc: A Gross Profit Performance Breakdown
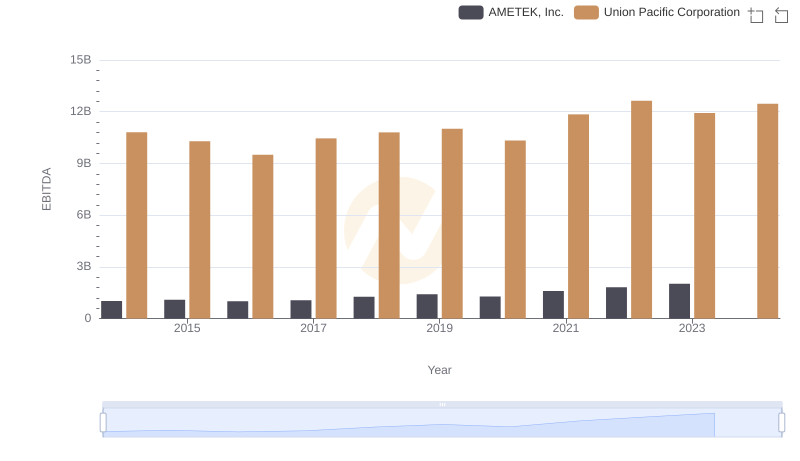
EBITDA Performance Review: Union Pacific Corporation vs AMETEK, Inc.
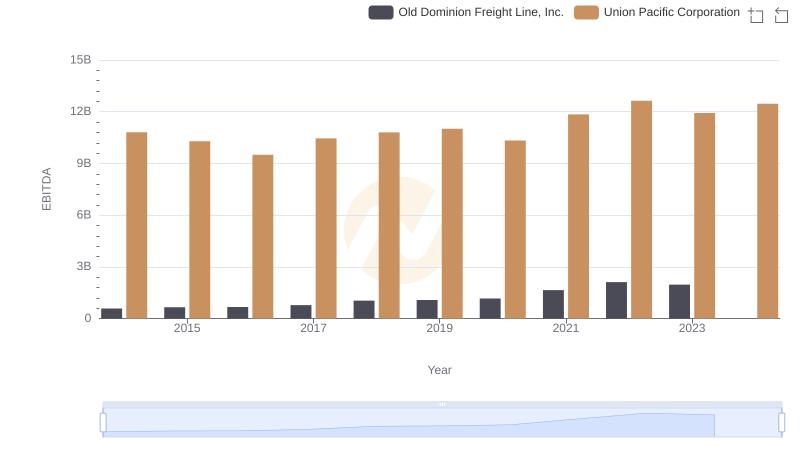
EBITDA Analysis: Evaluating Union Pacific Corporation Against Old Dominion Freight Line, Inc.
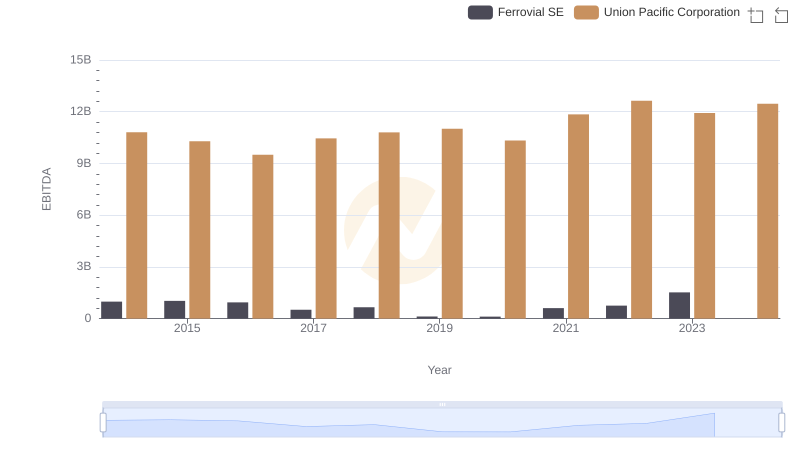
Union Pacific Corporation and Ferrovial SE: A Detailed Examination of EBITDA Performance

Union Pacific Corporation vs Xylem Inc.: In-Depth EBITDA Performance Comparison
Union Pacific Corporation vs Rockwell Automation, Inc.: In-Depth EBITDA Performance Comparison