| __timestamp | AMETEK, Inc. | Union Pacific Corporation |
|---|---|---|
| Wednesday, January 1, 2014 | 4021964000 | 23988000000 |
| Thursday, January 1, 2015 | 3974295000 | 21813000000 |
| Friday, January 1, 2016 | 3840087000 | 19941000000 |
| Sunday, January 1, 2017 | 4300170000 | 21240000000 |
| Monday, January 1, 2018 | 4845872000 | 22832000000 |
| Tuesday, January 1, 2019 | 5158557000 | 21708000000 |
| Wednesday, January 1, 2020 | 4540029000 | 19533000000 |
| Friday, January 1, 2021 | 5546514000 | 21804000000 |
| Saturday, January 1, 2022 | 6150530000 | 24875000000 |
| Sunday, January 1, 2023 | 6596950000 | 24119000000 |
| Monday, January 1, 2024 | 6941180000 | 24250000000 |
Infusing magic into the data realm
In the ever-evolving landscape of American industry, Union Pacific Corporation and AMETEK, Inc. stand as titans in their respective fields. Over the past decade, Union Pacific has consistently outperformed AMETEK in terms of revenue, boasting figures that are nearly four times higher. From 2014 to 2023, Union Pacific's revenue peaked in 2022, reaching approximately $24.9 billion, while AMETEK's highest revenue was around $6.6 billion in 2023.
Despite the disparity, AMETEK has shown impressive growth, with a 64% increase in revenue from 2014 to 2023. Union Pacific, on the other hand, experienced a more modest growth of 1% over the same period. The data for 2024 is incomplete, but Union Pacific's trajectory suggests continued dominance. This comparison highlights the diverse strategies and market positions of these two industrial powerhouses.
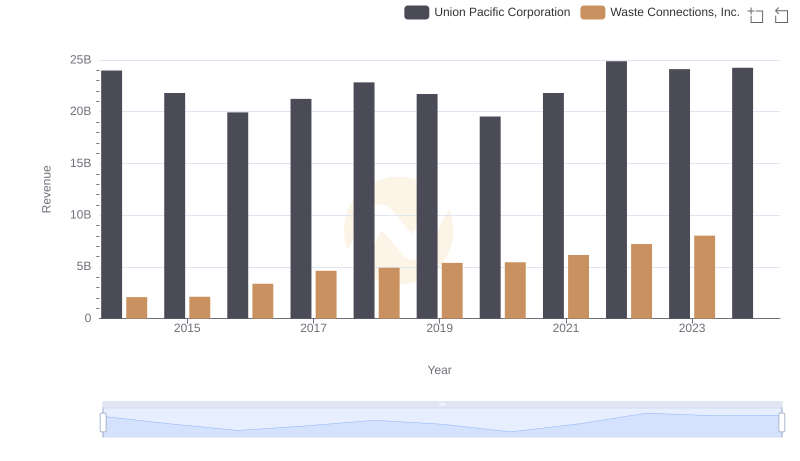
Union Pacific Corporation and Waste Connections, Inc.: A Comprehensive Revenue Analysis
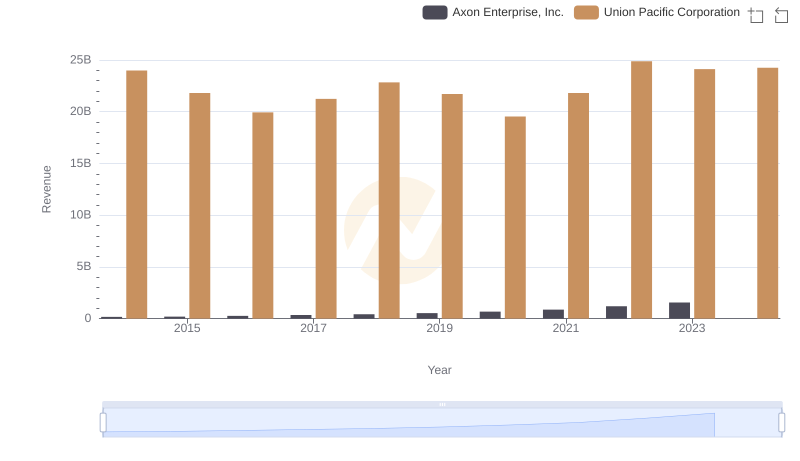
Union Pacific Corporation or Axon Enterprise, Inc.: Who Leads in Yearly Revenue?
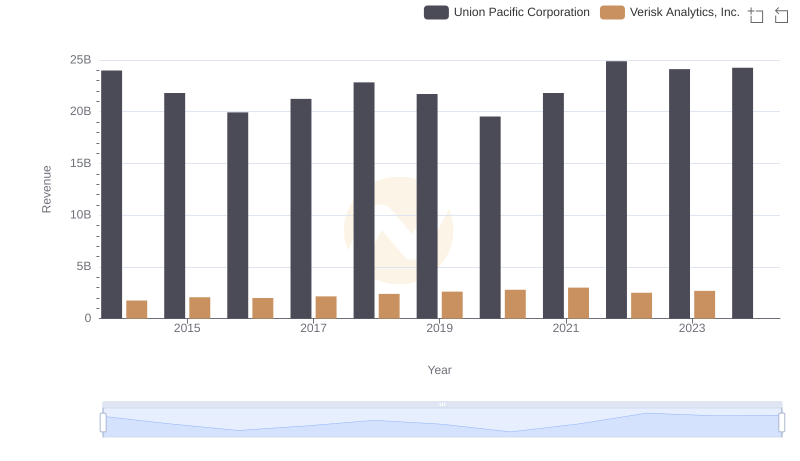
Union Pacific Corporation vs Verisk Analytics, Inc.: Examining Key Revenue Metrics
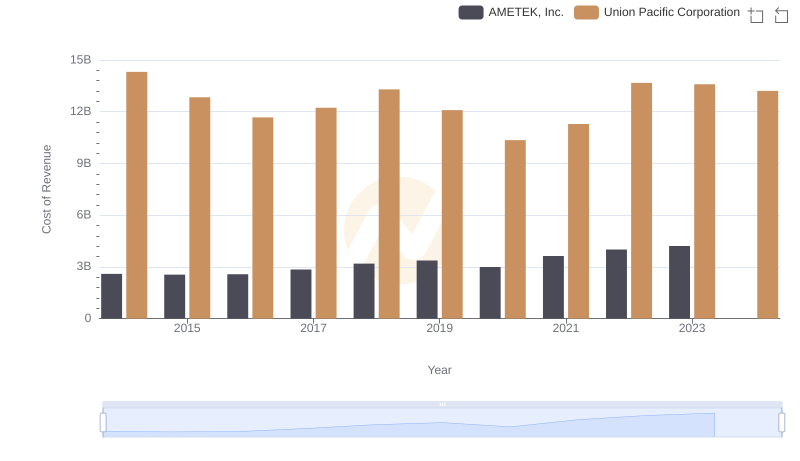
Analyzing Cost of Revenue: Union Pacific Corporation and AMETEK, Inc.
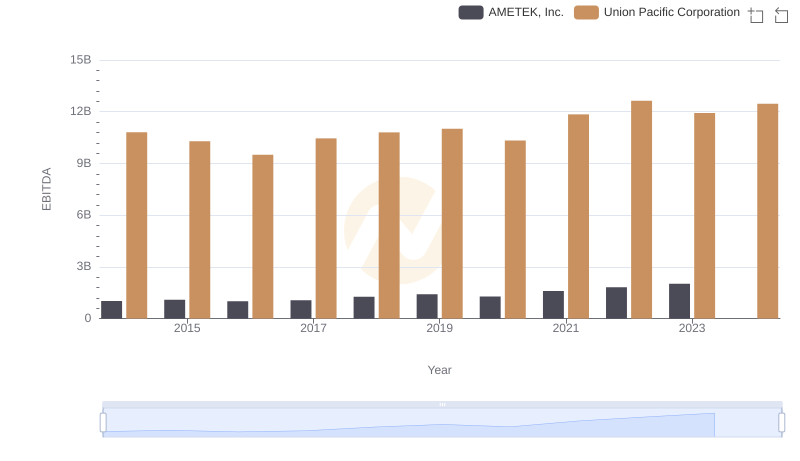
EBITDA Performance Review: Union Pacific Corporation vs AMETEK, Inc.