| __timestamp | Old Dominion Freight Line, Inc. | Union Pacific Corporation |
|---|---|---|
| Wednesday, January 1, 2014 | 585590000 | 10808000000 |
| Thursday, January 1, 2015 | 660570000 | 10290000000 |
| Friday, January 1, 2016 | 671786000 | 9502000000 |
| Sunday, January 1, 2017 | 783749000 | 10456000000 |
| Monday, January 1, 2018 | 1046059000 | 10802000000 |
| Tuesday, January 1, 2019 | 1078007000 | 11013000000 |
| Wednesday, January 1, 2020 | 1168149000 | 10331000000 |
| Friday, January 1, 2021 | 1651501000 | 11843000000 |
| Saturday, January 1, 2022 | 2118962000 | 12636000000 |
| Sunday, January 1, 2023 | 1972689000 | 11928000000 |
| Monday, January 1, 2024 | 12461000000 |
Unleashing the power of data
In the world of freight and logistics, Union Pacific Corporation and Old Dominion Freight Line, Inc. stand as titans. Over the past decade, Union Pacific has consistently outperformed Old Dominion in terms of EBITDA, showcasing its dominance in the industry. From 2014 to 2023, Union Pacific's EBITDA grew by approximately 11%, peaking in 2022. Meanwhile, Old Dominion saw a remarkable 237% increase, highlighting its rapid growth trajectory.
Union Pacific's EBITDA remained robust, averaging around $11 billion annually, while Old Dominion's figures, though smaller, demonstrated impressive growth, reaching over $2 billion in 2022. The data for 2024 is incomplete, but the trends suggest continued strength for both companies. This analysis underscores the dynamic nature of the freight industry and the strategic maneuvers of these two leaders.
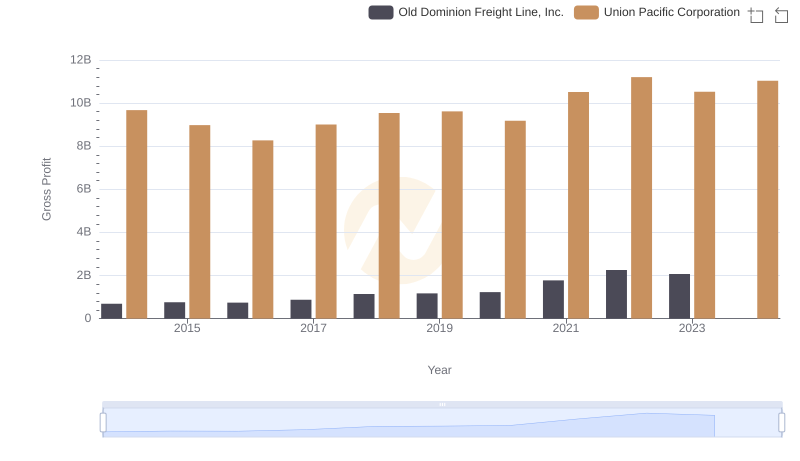
Who Generates Higher Gross Profit? Union Pacific Corporation or Old Dominion Freight Line, Inc.
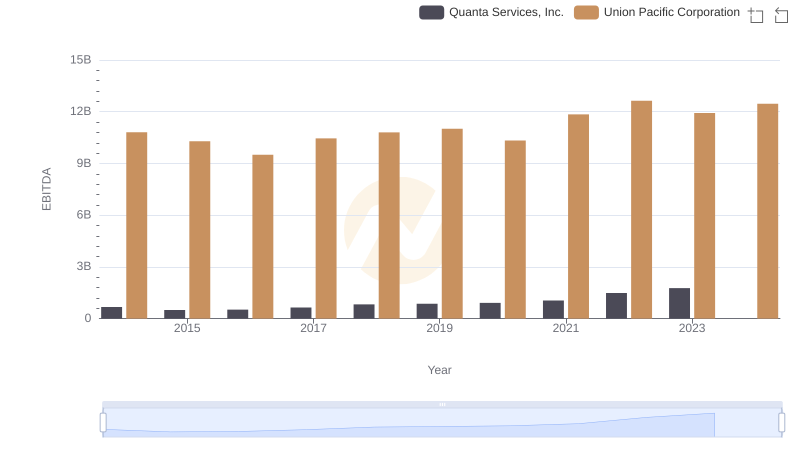
A Side-by-Side Analysis of EBITDA: Union Pacific Corporation and Quanta Services, Inc.
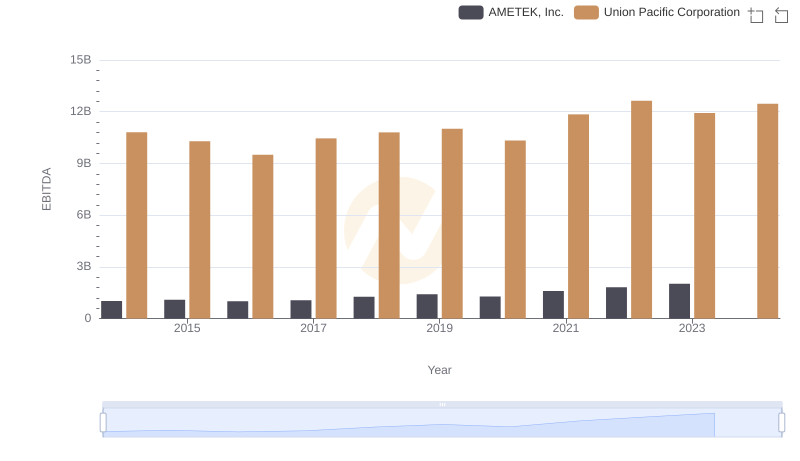
EBITDA Performance Review: Union Pacific Corporation vs AMETEK, Inc.

EBITDA Metrics Evaluated: Union Pacific Corporation vs Ferguson plc
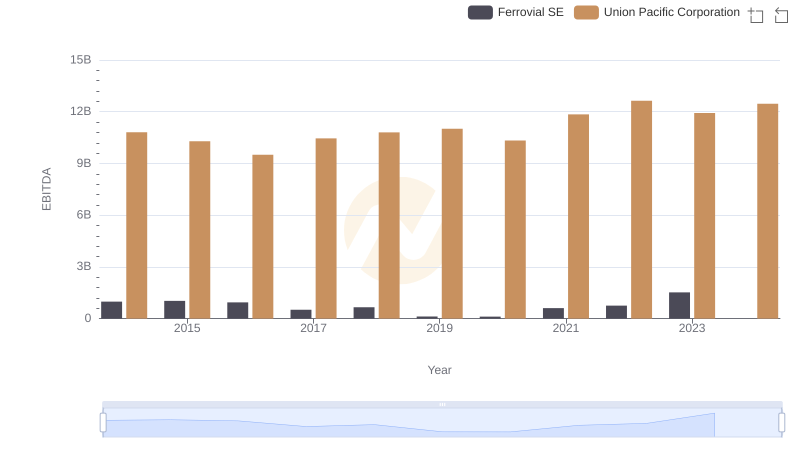
Union Pacific Corporation and Ferrovial SE: A Detailed Examination of EBITDA Performance

Union Pacific Corporation vs Xylem Inc.: In-Depth EBITDA Performance Comparison