| __timestamp | AMETEK, Inc. | Union Pacific Corporation |
|---|---|---|
| Wednesday, January 1, 2014 | 2597017000 | 14311000000 |
| Thursday, January 1, 2015 | 2549280000 | 12837000000 |
| Friday, January 1, 2016 | 2575220000 | 11672000000 |
| Sunday, January 1, 2017 | 2851431000 | 12231000000 |
| Monday, January 1, 2018 | 3186310000 | 13293000000 |
| Tuesday, January 1, 2019 | 3370897000 | 12094000000 |
| Wednesday, January 1, 2020 | 2996515000 | 10354000000 |
| Friday, January 1, 2021 | 3633900000 | 11290000000 |
| Saturday, January 1, 2022 | 4005261000 | 13670000000 |
| Sunday, January 1, 2023 | 4212484999 | 13590000000 |
| Monday, January 1, 2024 | 0 | 13211000000 |
Unlocking the unknown
In the ever-evolving landscape of American industry, understanding the cost of revenue is crucial for evaluating a company's financial health. Union Pacific Corporation, a titan in the railroad sector, and AMETEK, Inc., a leader in electronic instruments, offer a fascinating comparison. From 2014 to 2023, Union Pacific consistently reported higher costs, peaking in 2014 with a 14.3 billion USD expenditure. However, by 2020, this figure had decreased by approximately 28% to 10.4 billion USD, reflecting strategic cost management. Meanwhile, AMETEK's cost of revenue showed a steady upward trend, increasing by about 62% from 2014 to 2023, reaching over 4.2 billion USD. This growth underscores AMETEK's expanding market presence. Notably, 2024 data for AMETEK is missing, highlighting the need for continuous data monitoring. This analysis provides valuable insights into the financial strategies of these industrial giants.

Comparing Revenue Performance: Union Pacific Corporation or AMETEK, Inc.?
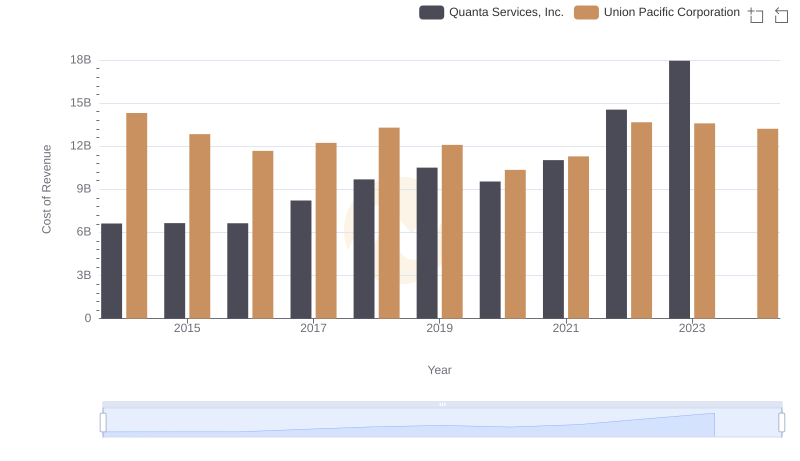
Cost of Revenue: Key Insights for Union Pacific Corporation and Quanta Services, Inc.

Cost of Revenue: Key Insights for Union Pacific Corporation and Westinghouse Air Brake Technologies Corporation
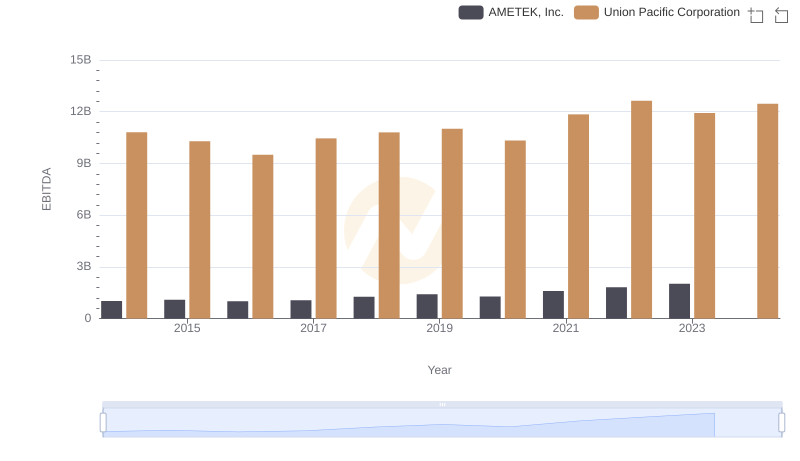
EBITDA Performance Review: Union Pacific Corporation vs AMETEK, Inc.