| __timestamp | Ferrovial SE | Union Pacific Corporation |
|---|---|---|
| Wednesday, January 1, 2014 | 983000000 | 10808000000 |
| Thursday, January 1, 2015 | 1027000000 | 10290000000 |
| Friday, January 1, 2016 | 943000000 | 9502000000 |
| Sunday, January 1, 2017 | 515000000 | 10456000000 |
| Monday, January 1, 2018 | 661000000 | 10802000000 |
| Tuesday, January 1, 2019 | 121000000 | 11013000000 |
| Wednesday, January 1, 2020 | 116000000 | 10331000000 |
| Friday, January 1, 2021 | 610000000 | 11843000000 |
| Saturday, January 1, 2022 | 756000000 | 12636000000 |
| Sunday, January 1, 2023 | 1524000000 | 11928000000 |
| Monday, January 1, 2024 | 12461000000 |
Igniting the spark of knowledge
In the ever-evolving landscape of global transportation, Union Pacific Corporation and Ferrovial SE stand as titans of industry. From 2014 to 2023, Union Pacific consistently outperformed Ferrovial in EBITDA, showcasing a robust financial health. Union Pacific's EBITDA peaked in 2022, reaching approximately 12.6 billion, a 33% increase from its 2016 low. Meanwhile, Ferrovial's EBITDA saw a dramatic rise in 2023, more than doubling from its 2020 nadir, reflecting strategic shifts and market adaptations.
This analysis underscores the dynamic nature of the transportation sector, where strategic foresight and adaptability are key to sustained success.
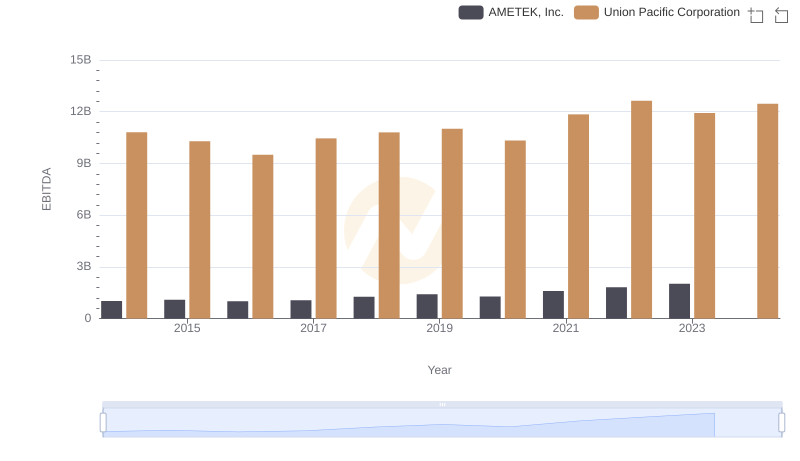
EBITDA Performance Review: Union Pacific Corporation vs AMETEK, Inc.
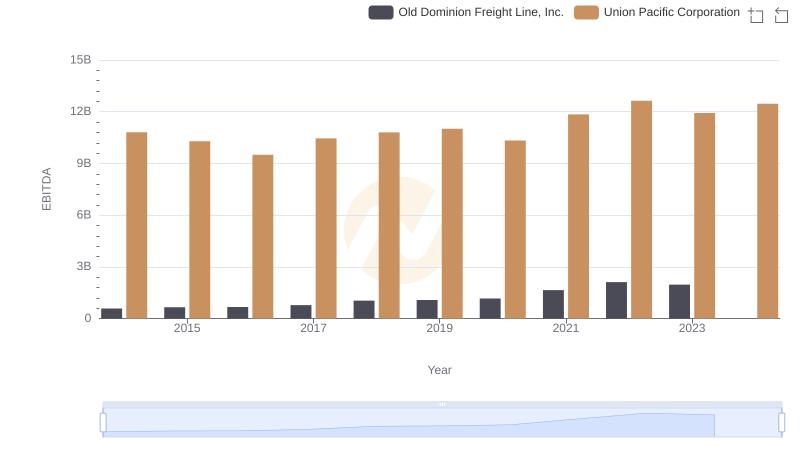
EBITDA Analysis: Evaluating Union Pacific Corporation Against Old Dominion Freight Line, Inc.

EBITDA Metrics Evaluated: Union Pacific Corporation vs Ferguson plc

Union Pacific Corporation vs Xylem Inc.: In-Depth EBITDA Performance Comparison
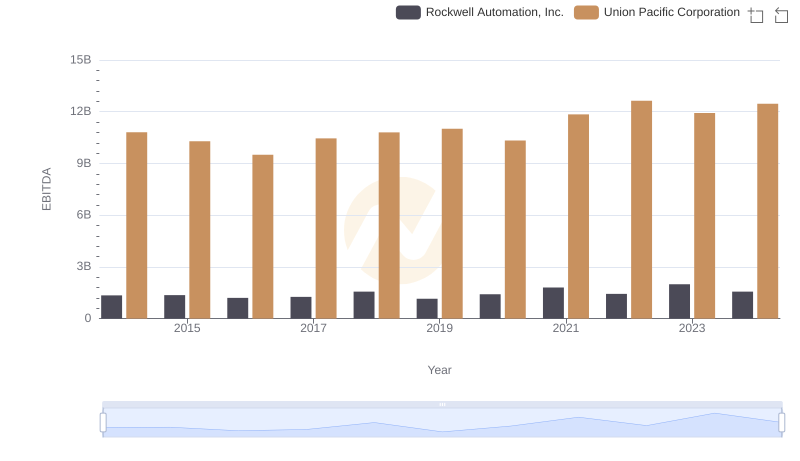
Union Pacific Corporation vs Rockwell Automation, Inc.: In-Depth EBITDA Performance Comparison