| __timestamp | Dover Corporation | Old Dominion Freight Line, Inc. |
|---|---|---|
| Wednesday, January 1, 2014 | 1533084000 | 585590000 |
| Thursday, January 1, 2015 | 1259375000 | 660570000 |
| Friday, January 1, 2016 | 1186472000 | 671786000 |
| Sunday, January 1, 2017 | 1304041000 | 783749000 |
| Monday, January 1, 2018 | 1138930000 | 1046059000 |
| Tuesday, January 1, 2019 | 1241114000 | 1078007000 |
| Wednesday, January 1, 2020 | 1232722000 | 1168149000 |
| Friday, January 1, 2021 | 1797268000 | 1651501000 |
| Saturday, January 1, 2022 | 1711499000 | 2118962000 |
| Sunday, January 1, 2023 | 1718774000 | 1972689000 |
| Monday, January 1, 2024 | 1206355000 |
Unleashing insights
In the competitive landscape of the transportation and manufacturing sectors, Old Dominion Freight Line, Inc. and Dover Corporation have showcased remarkable EBITDA growth over the past decade. From 2014 to 2023, Old Dominion Freight Line, Inc. has seen its EBITDA surge by an impressive 237%, reflecting its robust operational efficiency and strategic market positioning. Meanwhile, Dover Corporation, a stalwart in the manufacturing industry, has maintained a steady growth trajectory, with a 12% increase in EBITDA over the same period.
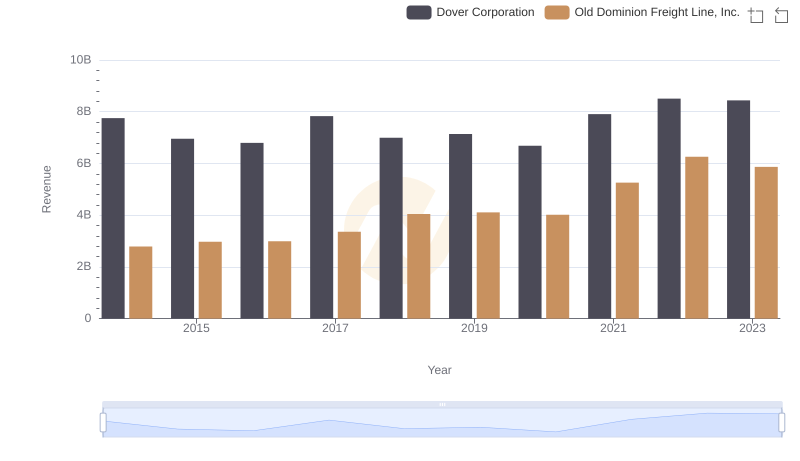
Old Dominion Freight Line, Inc. vs Dover Corporation: Examining Key Revenue Metrics
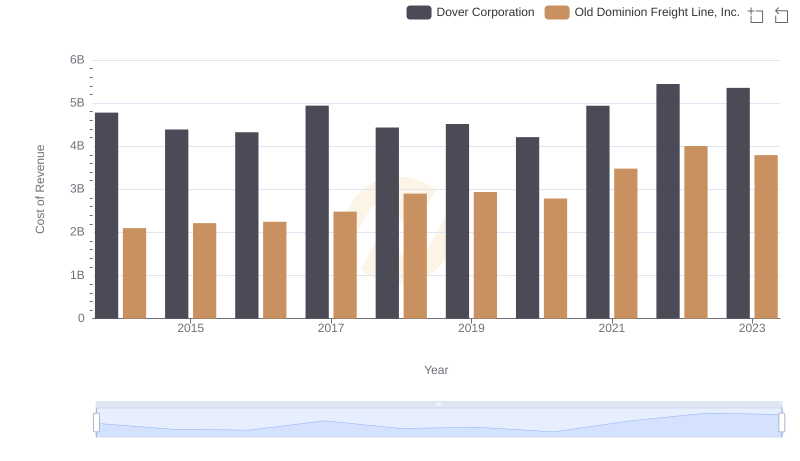
Cost of Revenue Comparison: Old Dominion Freight Line, Inc. vs Dover Corporation
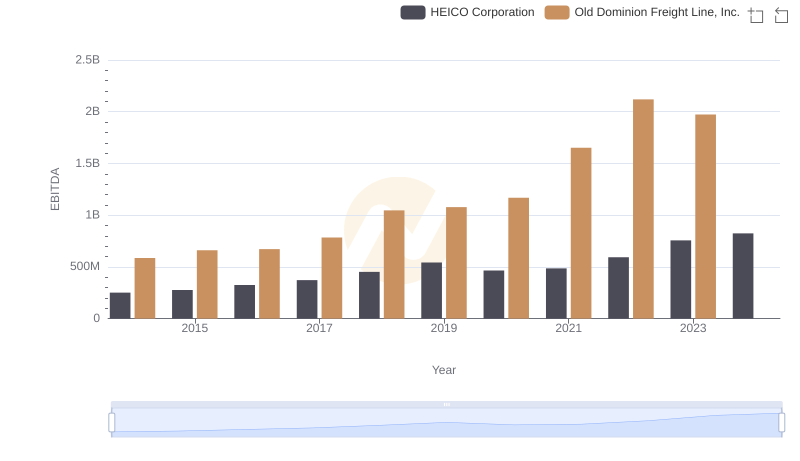
EBITDA Performance Review: Old Dominion Freight Line, Inc. vs HEICO Corporation
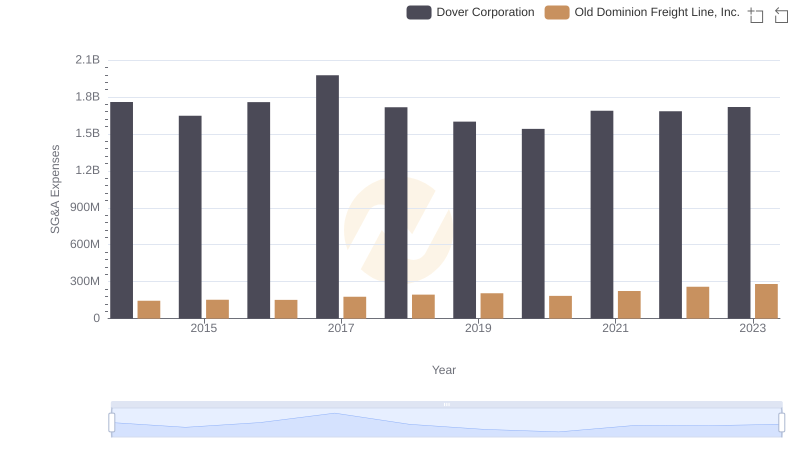
Old Dominion Freight Line, Inc. vs Dover Corporation: SG&A Expense Trends
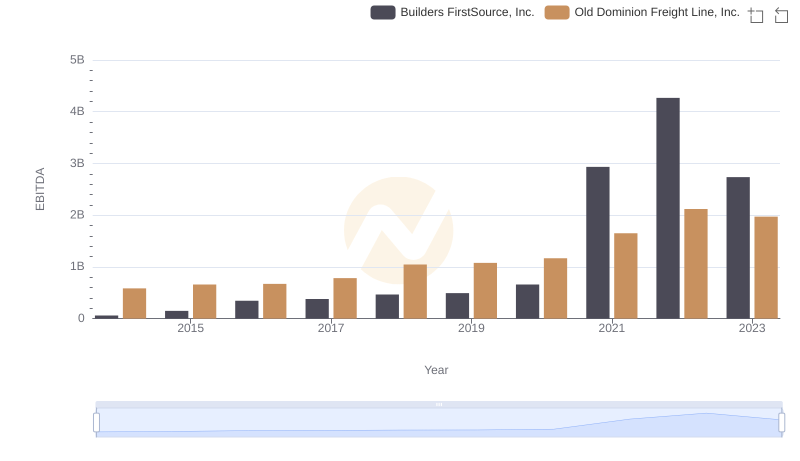
Comprehensive EBITDA Comparison: Old Dominion Freight Line, Inc. vs Builders FirstSource, Inc.
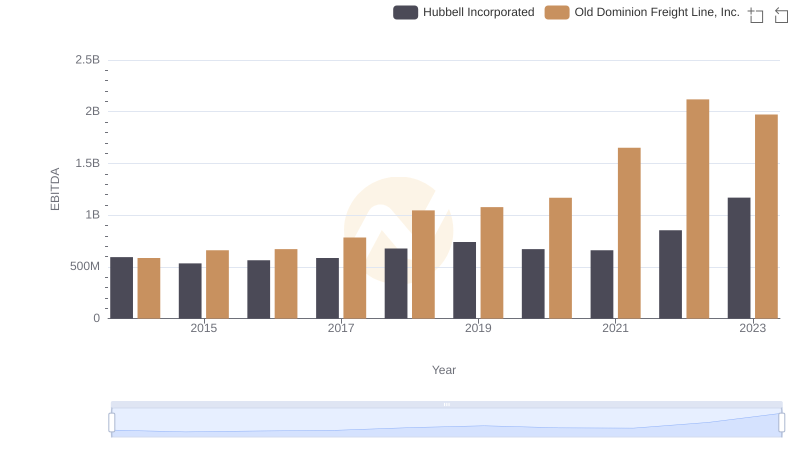
Comprehensive EBITDA Comparison: Old Dominion Freight Line, Inc. vs Hubbell Incorporated
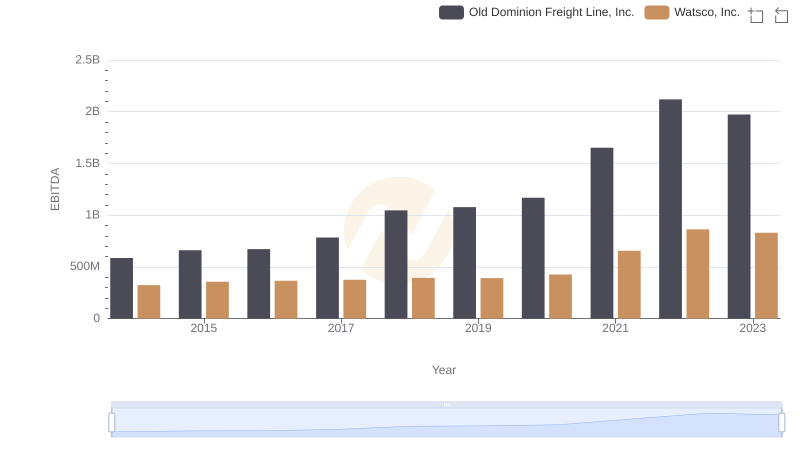
Old Dominion Freight Line, Inc. and Watsco, Inc.: A Detailed Examination of EBITDA Performance
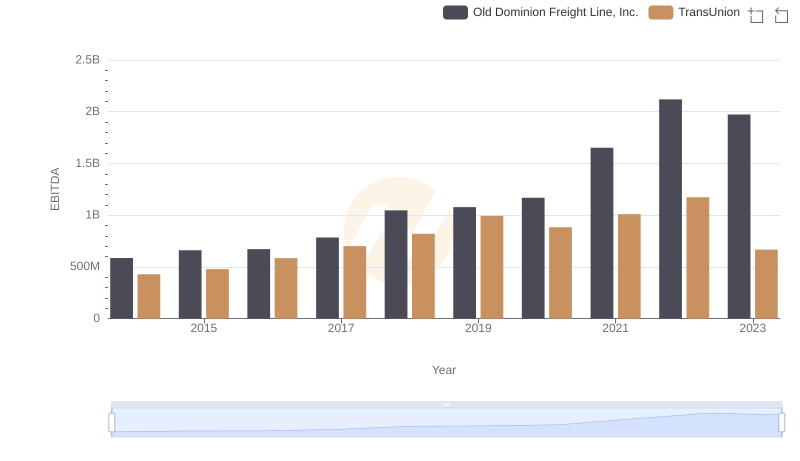
A Side-by-Side Analysis of EBITDA: Old Dominion Freight Line, Inc. and TransUnion