| __timestamp | Dover Corporation | Old Dominion Freight Line, Inc. |
|---|---|---|
| Wednesday, January 1, 2014 | 7752728000 | 2787897000 |
| Thursday, January 1, 2015 | 6956311000 | 2972442000 |
| Friday, January 1, 2016 | 6794342000 | 2991517000 |
| Sunday, January 1, 2017 | 7830436000 | 3358112000 |
| Monday, January 1, 2018 | 6992118000 | 4043695000 |
| Tuesday, January 1, 2019 | 7136397000 | 4109111000 |
| Wednesday, January 1, 2020 | 6683760000 | 4015129000 |
| Friday, January 1, 2021 | 7907081000 | 5256328000 |
| Saturday, January 1, 2022 | 8508088000 | 6260077000 |
| Sunday, January 1, 2023 | 8438134000 | 5866152000 |
| Monday, January 1, 2024 | 7745909000 |
Igniting the spark of knowledge
In the ever-evolving landscape of American industry, Old Dominion Freight Line, Inc. and Dover Corporation stand as titans in their respective fields. Over the past decade, these companies have showcased remarkable growth and resilience. From 2014 to 2023, Old Dominion Freight Line, Inc. saw its revenue soar by approximately 111%, reflecting its robust expansion in the freight and logistics sector. Meanwhile, Dover Corporation, a stalwart in diversified industrial products, experienced a more modest growth of around 9% during the same period.
These trends underscore the dynamic nature of these industries and the strategic maneuvers that have propelled these companies forward.
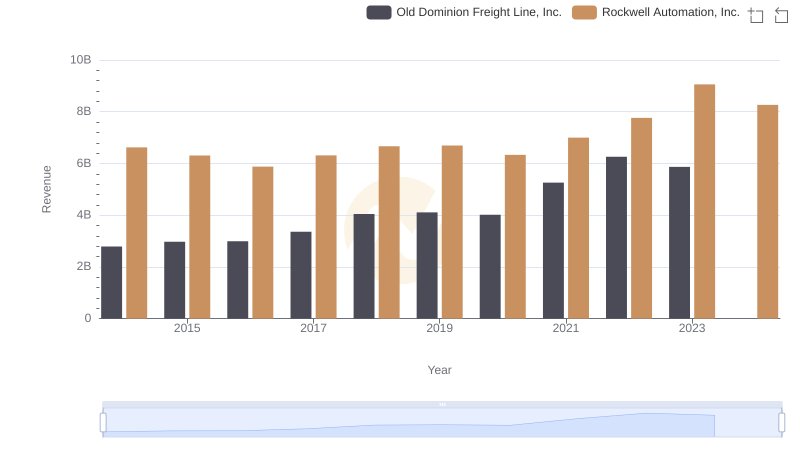
Breaking Down Revenue Trends: Old Dominion Freight Line, Inc. vs Rockwell Automation, Inc.
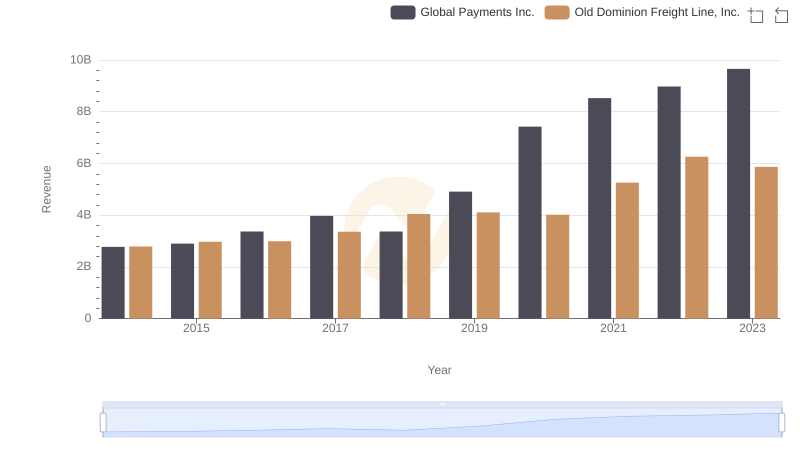
Comparing Revenue Performance: Old Dominion Freight Line, Inc. or Global Payments Inc.?
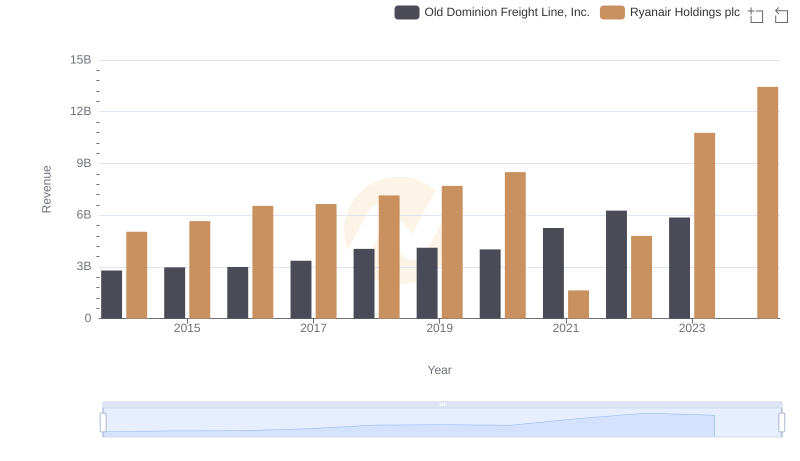
Old Dominion Freight Line, Inc. vs Ryanair Holdings plc: Examining Key Revenue Metrics
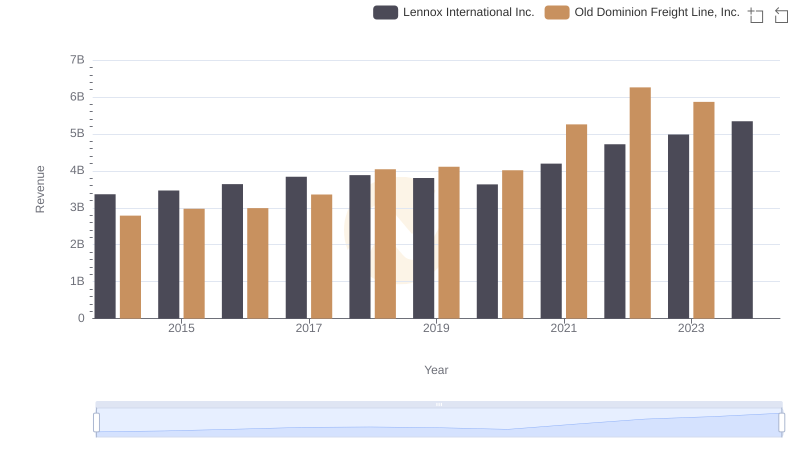
Old Dominion Freight Line, Inc. vs Lennox International Inc.: Annual Revenue Growth Compared
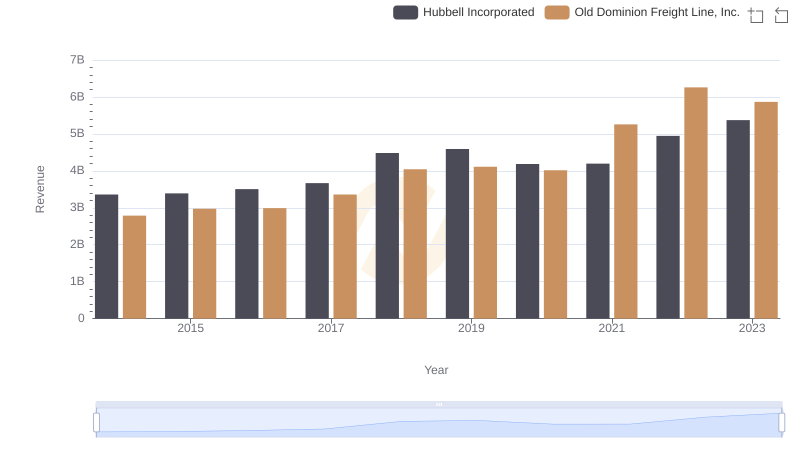
Old Dominion Freight Line, Inc. or Hubbell Incorporated: Who Leads in Yearly Revenue?
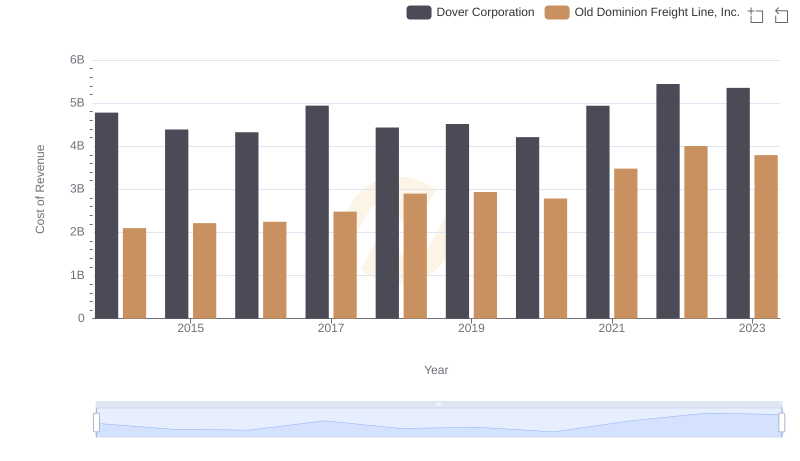
Cost of Revenue Comparison: Old Dominion Freight Line, Inc. vs Dover Corporation
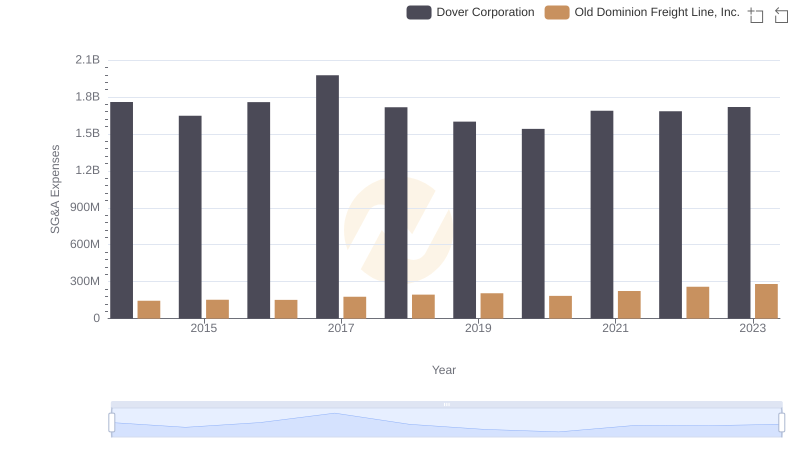
Old Dominion Freight Line, Inc. vs Dover Corporation: SG&A Expense Trends
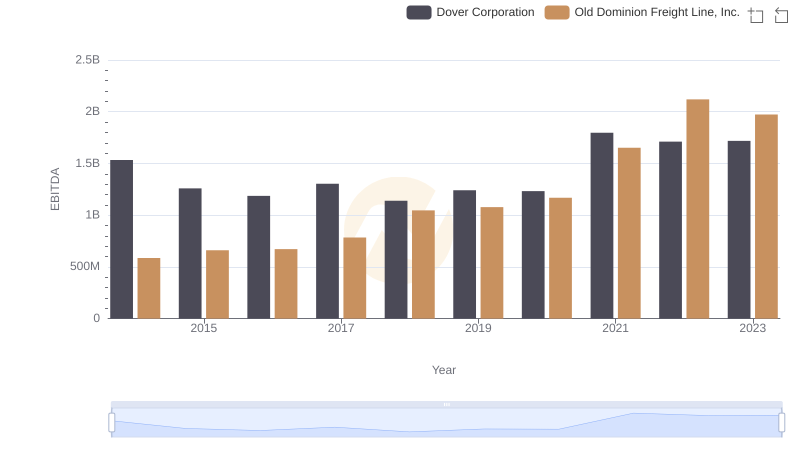
EBITDA Performance Review: Old Dominion Freight Line, Inc. vs Dover Corporation