| __timestamp | Old Dominion Freight Line, Inc. | TransUnion |
|---|---|---|
| Wednesday, January 1, 2014 | 585590000 | 429400000 |
| Thursday, January 1, 2015 | 660570000 | 478200000 |
| Friday, January 1, 2016 | 671786000 | 585300000 |
| Sunday, January 1, 2017 | 783749000 | 701100000 |
| Monday, January 1, 2018 | 1046059000 | 819800000 |
| Tuesday, January 1, 2019 | 1078007000 | 993200000 |
| Wednesday, January 1, 2020 | 1168149000 | 883400000 |
| Friday, January 1, 2021 | 1651501000 | 1010500000 |
| Saturday, January 1, 2022 | 2118962000 | 1173800000 |
| Sunday, January 1, 2023 | 1972689000 | 667300000 |
| Monday, January 1, 2024 | 1204100000 |
Unveiling the hidden dimensions of data
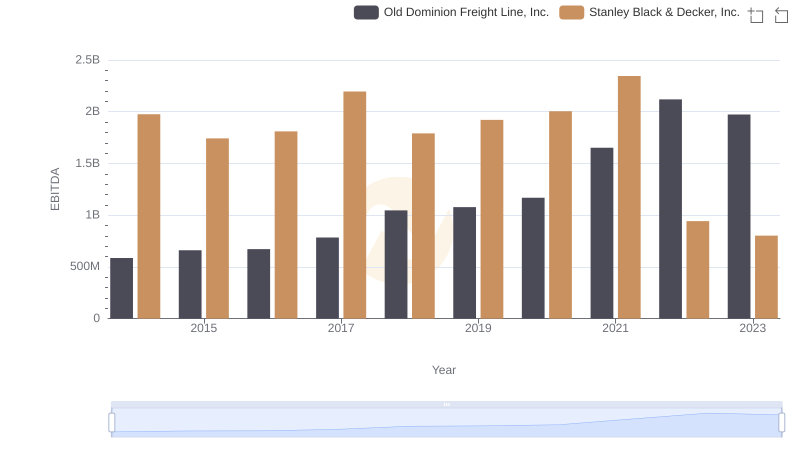
In the world of finance, EBITDA (Earnings Before Interest, Taxes, Depreciation, and Amortization) serves as a key indicator of a company's operational performance. Over the past decade, Old Dominion Freight Line, Inc. and TransUnion have showcased intriguing trajectories in their EBITDA growth. From 2014 to 2023, Old Dominion Freight Line, Inc. experienced a remarkable 237% increase, peaking in 2022. This growth reflects the company's robust operational strategies and market adaptability. In contrast, TransUnion's EBITDA grew by approximately 173% during the same period, with a notable peak in 2022. However, 2023 saw a decline for both companies, with Old Dominion Freight Line, Inc. dropping by 7% and TransUnion by 43%. This divergence in performance highlights the dynamic nature of the market and the varying challenges faced by these industry giants.
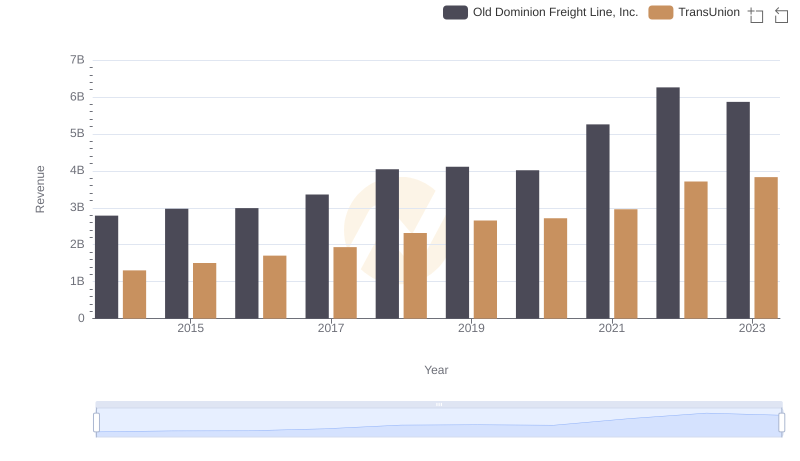
Revenue Insights: Old Dominion Freight Line, Inc. and TransUnion Performance Compared
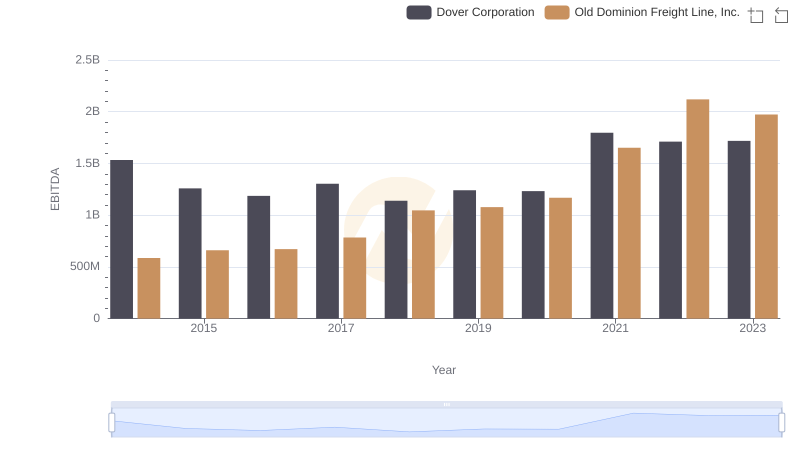
EBITDA Performance Review: Old Dominion Freight Line, Inc. vs Dover Corporation
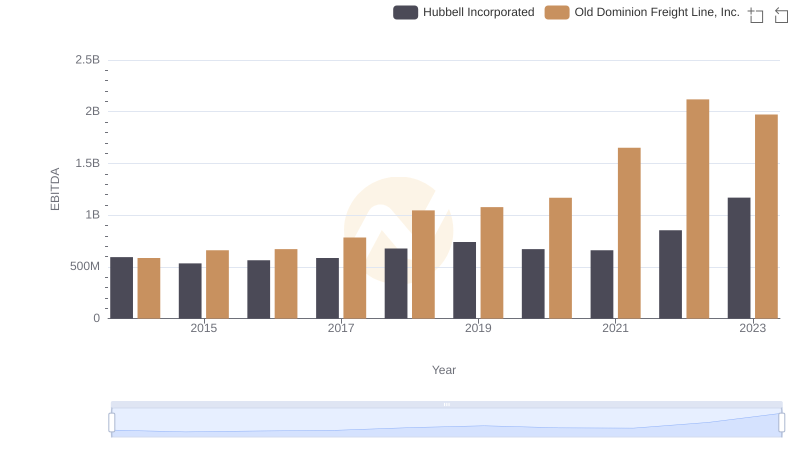
Comprehensive EBITDA Comparison: Old Dominion Freight Line, Inc. vs Hubbell Incorporated
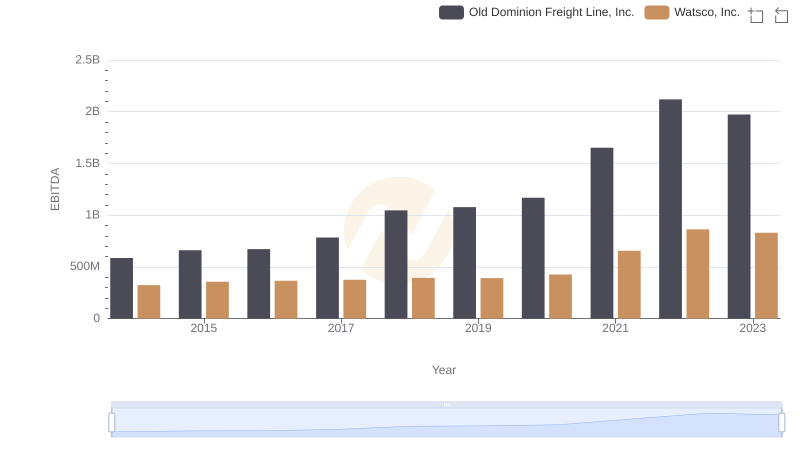
Old Dominion Freight Line, Inc. and Watsco, Inc.: A Detailed Examination of EBITDA Performance
Old Dominion Freight Line, Inc. vs Stanley Black & Decker, Inc.: In-Depth EBITDA Performance Comparison