| __timestamp | Infosys Limited | VMware, Inc. |
|---|---|---|
| Wednesday, January 1, 2014 | 2258000000 | 1526000000 |
| Thursday, January 1, 2015 | 2590000000 | 1395000000 |
| Friday, January 1, 2016 | 2765000000 | 1548000000 |
| Sunday, January 1, 2017 | 2936000000 | 1819000000 |
| Monday, January 1, 2018 | 2984000000 | 2181000000 |
| Tuesday, January 1, 2019 | 3053000000 | 3495000000 |
| Wednesday, January 1, 2020 | 4053342784 | 2479000000 |
| Friday, January 1, 2021 | 4116000000 | 3646000000 |
| Saturday, January 1, 2022 | 4707334610 | 3446000000 |
| Sunday, January 1, 2023 | 4206000000 | 3273000000 |
Cracking the code
In the ever-evolving landscape of global technology, the financial health of companies is a key indicator of their resilience and growth. Over the past decade, Infosys Limited and VMware, Inc. have showcased intriguing trends in their EBITDA, a critical measure of profitability. From 2014 to 2023, Infosys Limited has consistently outperformed VMware, Inc., with an average EBITDA approximately 36% higher. Notably, Infosys saw a remarkable 86% increase in EBITDA from 2014 to 2022, peaking in 2022. Meanwhile, VMware experienced a more volatile journey, with a significant 127% rise from 2014 to 2019, followed by fluctuations. The year 2019 marked a pivotal point for VMware, with its EBITDA surpassing Infosys for the first time. This financial narrative underscores the dynamic nature of the tech industry, where strategic decisions and market conditions shape the financial trajectories of leading firms.
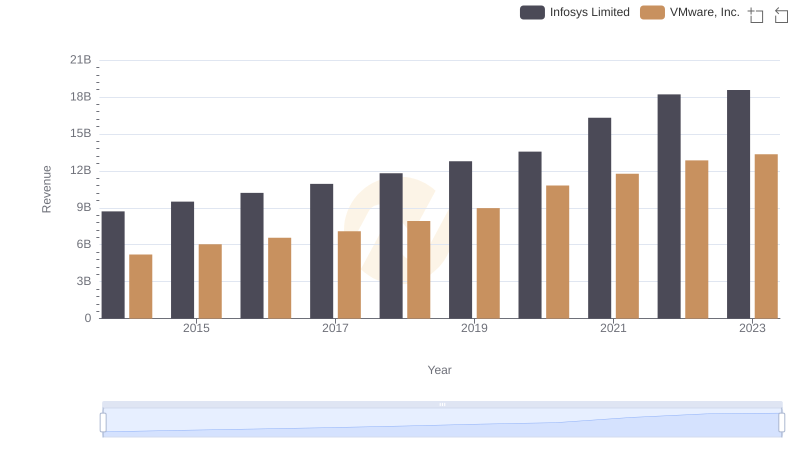
Who Generates More Revenue? Infosys Limited or VMware, Inc.
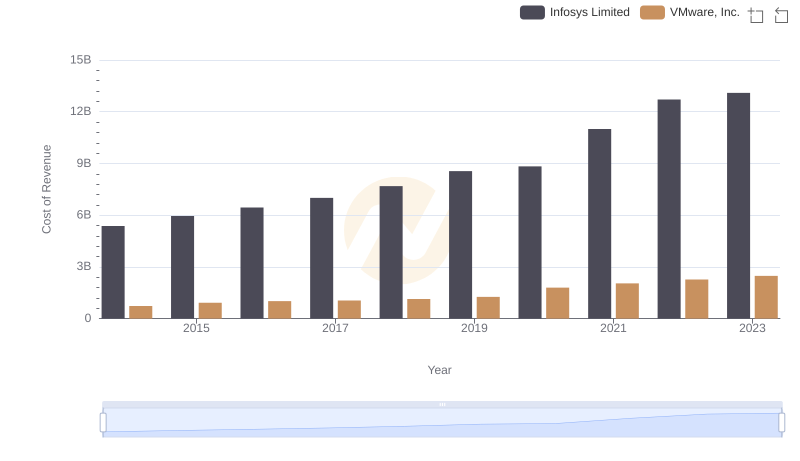
Cost Insights: Breaking Down Infosys Limited and VMware, Inc.'s Expenses
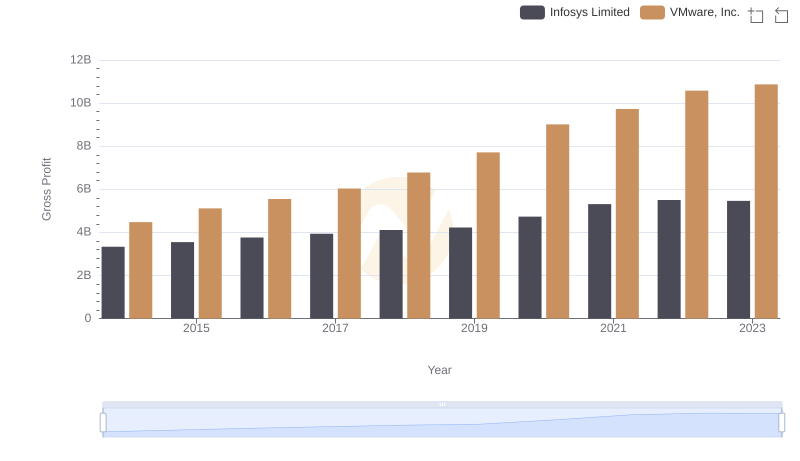
Gross Profit Trends Compared: Infosys Limited vs VMware, Inc.
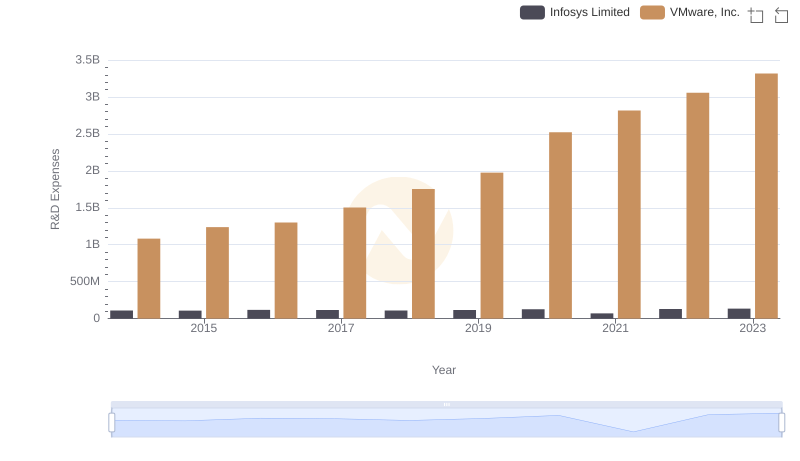
Research and Development Expenses Breakdown: Infosys Limited vs VMware, Inc.
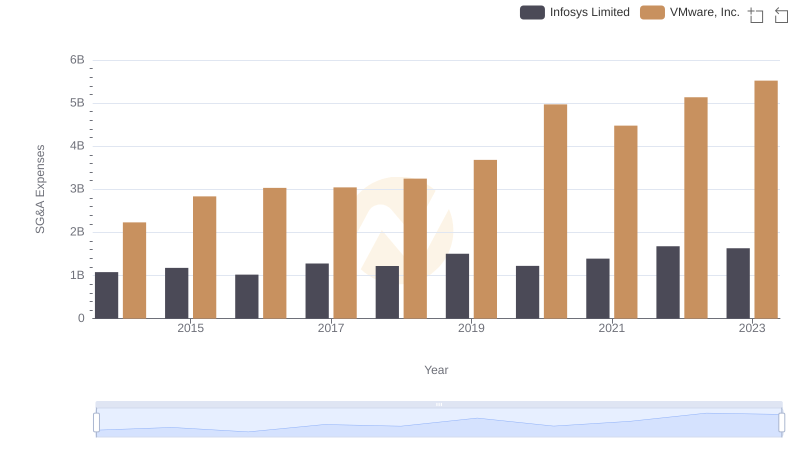
SG&A Efficiency Analysis: Comparing Infosys Limited and VMware, Inc.
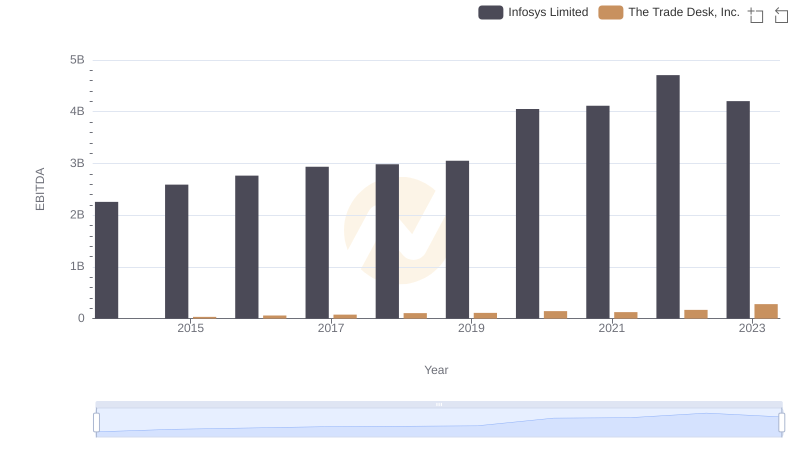
Infosys Limited and The Trade Desk, Inc.: A Detailed Examination of EBITDA Performance
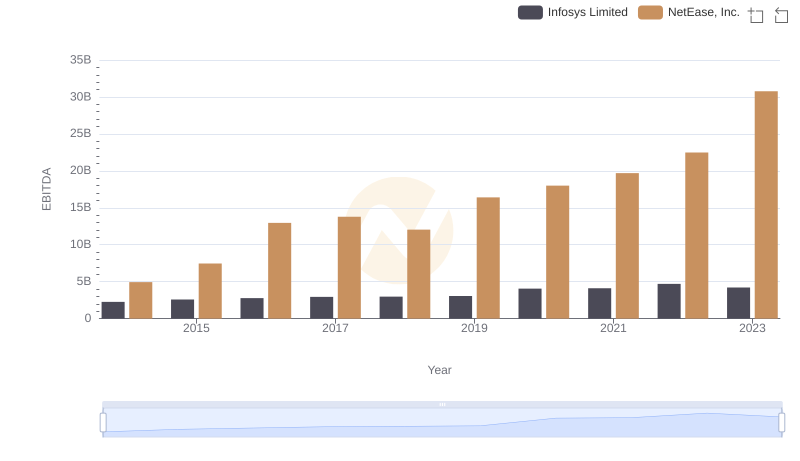
A Side-by-Side Analysis of EBITDA: Infosys Limited and NetEase, Inc.
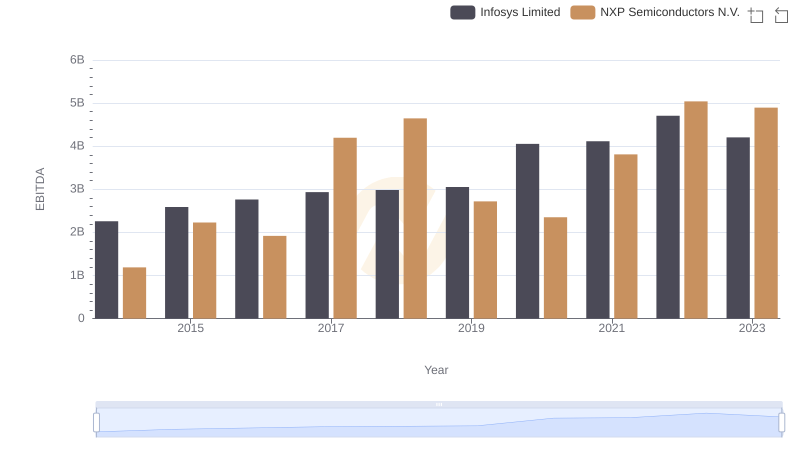
EBITDA Metrics Evaluated: Infosys Limited vs NXP Semiconductors N.V.
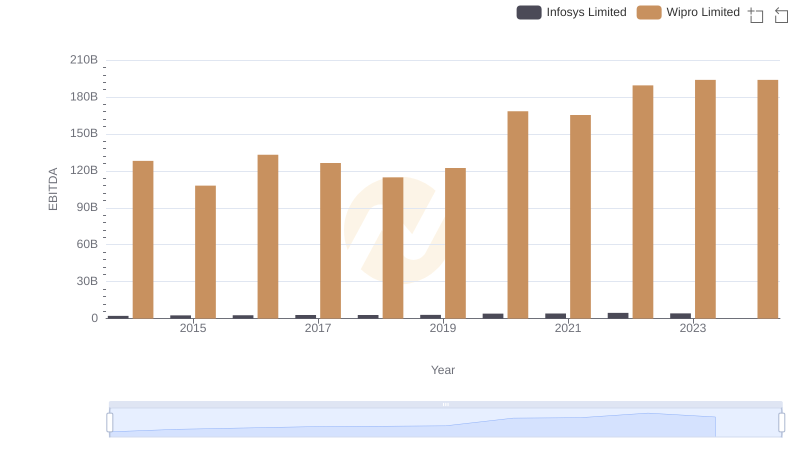
Comparative EBITDA Analysis: Infosys Limited vs Wipro Limited
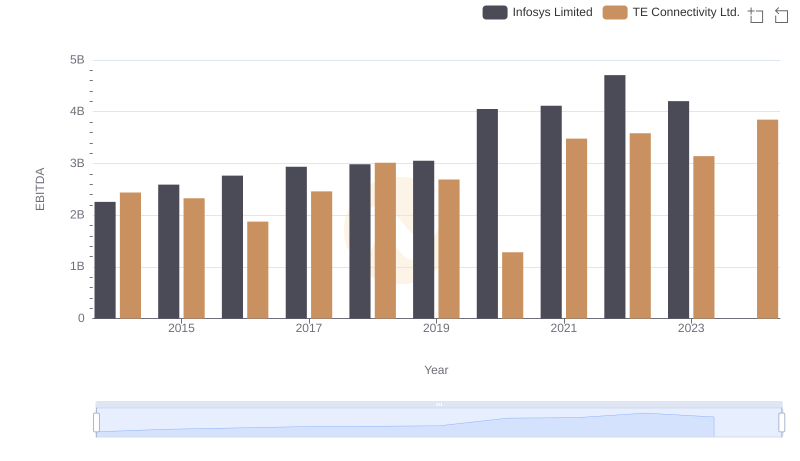
Professional EBITDA Benchmarking: Infosys Limited vs TE Connectivity Ltd.
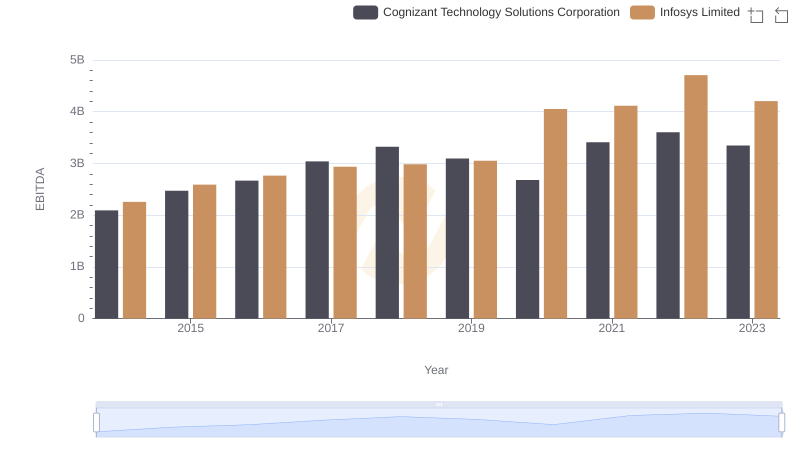
Professional EBITDA Benchmarking: Infosys Limited vs Cognizant Technology Solutions Corporation
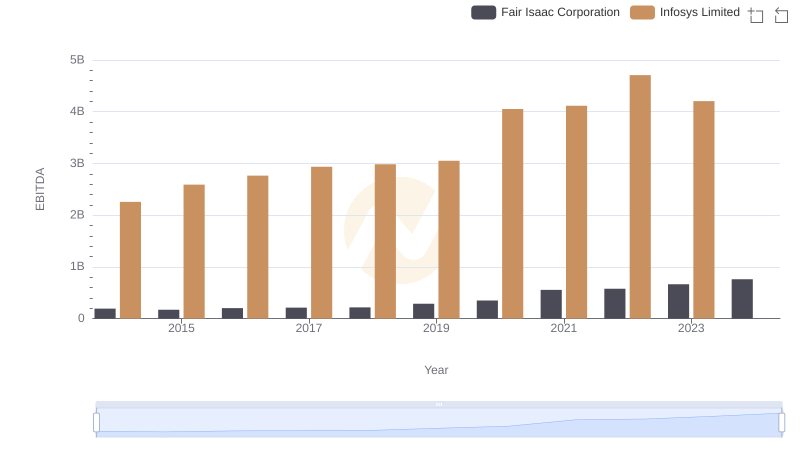
A Side-by-Side Analysis of EBITDA: Infosys Limited and Fair Isaac Corporation