| __timestamp | Infosys Limited | NetApp, Inc. |
|---|---|---|
| Wednesday, January 1, 2014 | 8711000000 | 6325100000 |
| Thursday, January 1, 2015 | 9501000000 | 6122700000 |
| Friday, January 1, 2016 | 10208000000 | 5546000000 |
| Sunday, January 1, 2017 | 10939000000 | 5519000000 |
| Monday, January 1, 2018 | 11799000000 | 5911000000 |
| Tuesday, January 1, 2019 | 12780000000 | 6146000000 |
| Wednesday, January 1, 2020 | 13561000000 | 5412000000 |
| Friday, January 1, 2021 | 16311000000 | 5744000000 |
| Saturday, January 1, 2022 | 18212000000 | 6318000000 |
| Sunday, January 1, 2023 | 18562000000 | 6362000000 |
| Monday, January 1, 2024 | 6268000000 |
Infusing magic into the data realm
In the ever-evolving landscape of technology, revenue growth is a key indicator of a company's success. Over the past decade, Infosys Limited and NetApp, Inc. have showcased contrasting trajectories in their annual revenues. From 2014 to 2023, Infosys Limited has seen a remarkable increase of over 110% in its revenue, starting from approximately $8.7 billion in 2014 to an impressive $18.6 billion in 2023. This growth underscores Infosys's strategic expansion and adaptation to global market demands.
Conversely, NetApp, Inc. has experienced a more modest revenue growth of around 1% over the same period, with revenues fluctuating between $5.4 billion and $6.4 billion. This steady performance highlights NetApp's resilience in a competitive market, despite facing challenges in maintaining a consistent upward trend. Notably, data for Infosys in 2024 is missing, leaving room for speculation on its future performance.
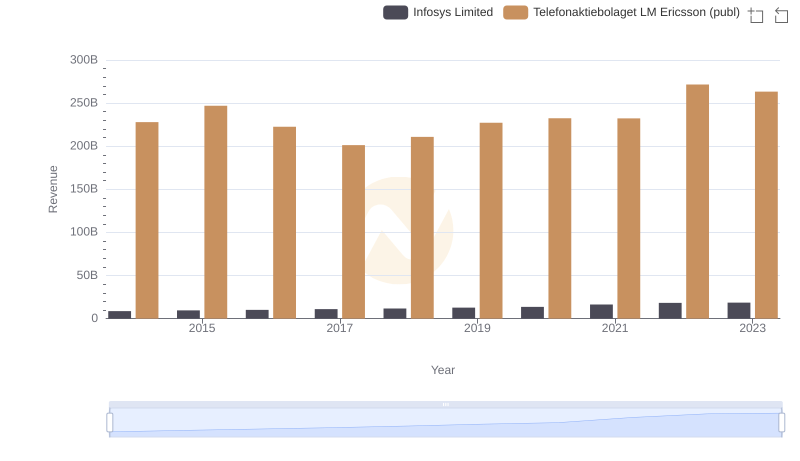
Infosys Limited vs Telefonaktiebolaget LM Ericsson (publ): Annual Revenue Growth Compared
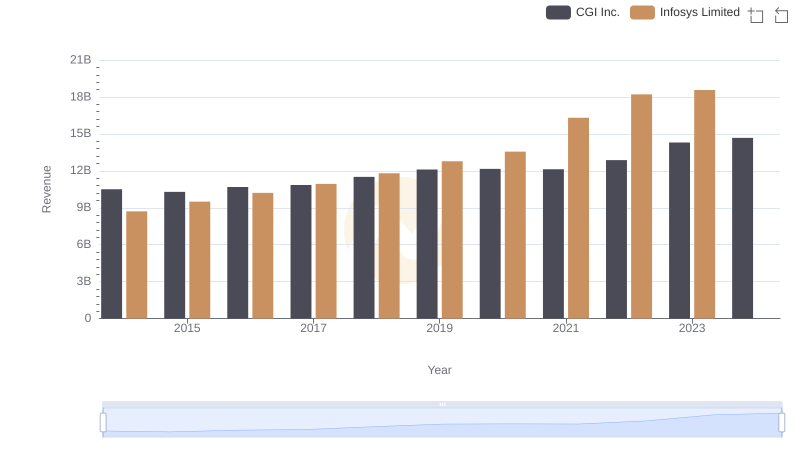
Infosys Limited or CGI Inc.: Who Leads in Yearly Revenue?
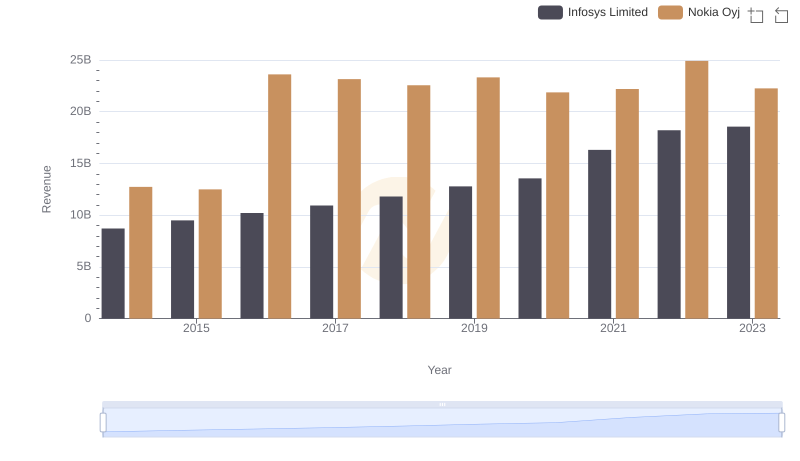
Who Generates More Revenue? Infosys Limited or Nokia Oyj
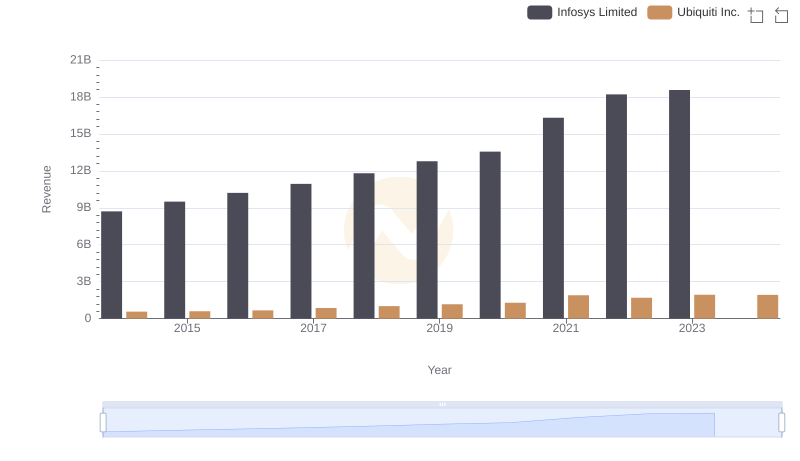
Annual Revenue Comparison: Infosys Limited vs Ubiquiti Inc.
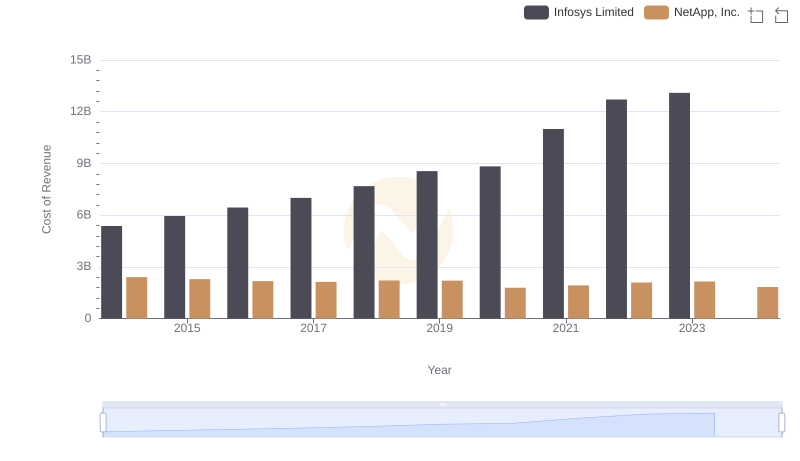
Cost of Revenue Comparison: Infosys Limited vs NetApp, Inc.
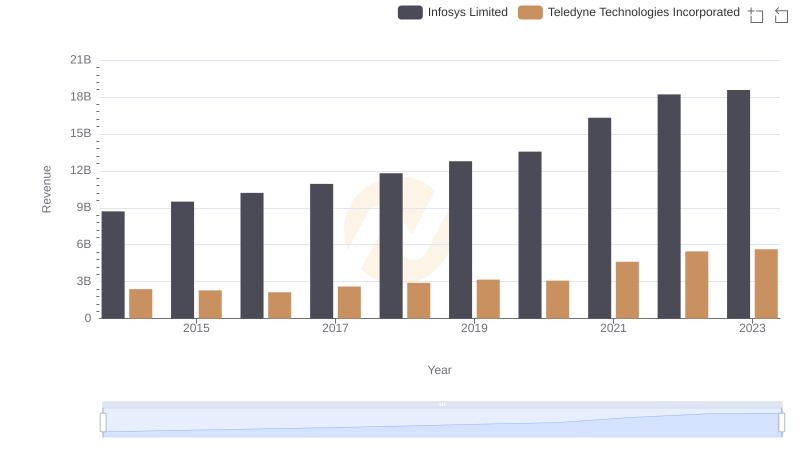
Revenue Showdown: Infosys Limited vs Teledyne Technologies Incorporated
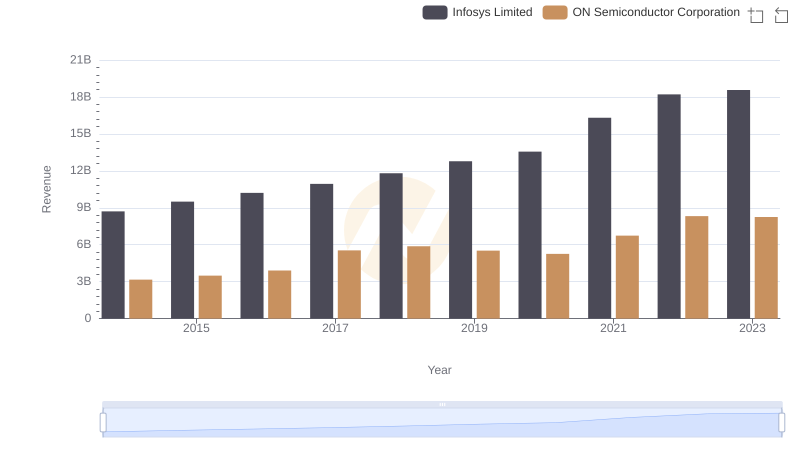
Revenue Showdown: Infosys Limited vs ON Semiconductor Corporation
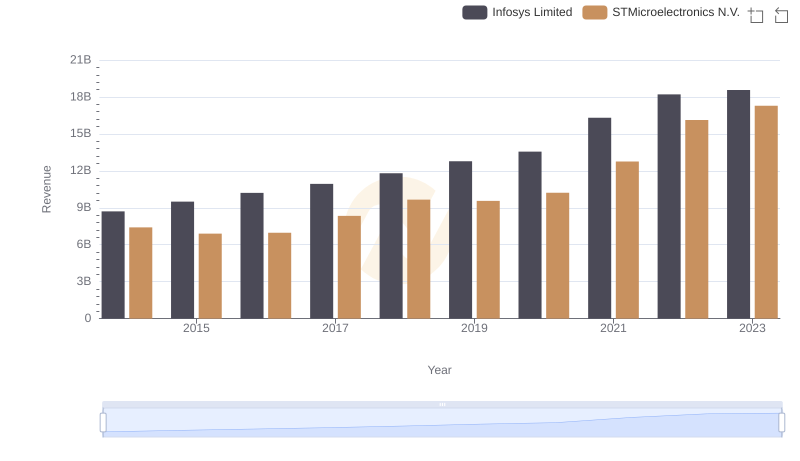
Infosys Limited vs STMicroelectronics N.V.: Examining Key Revenue Metrics
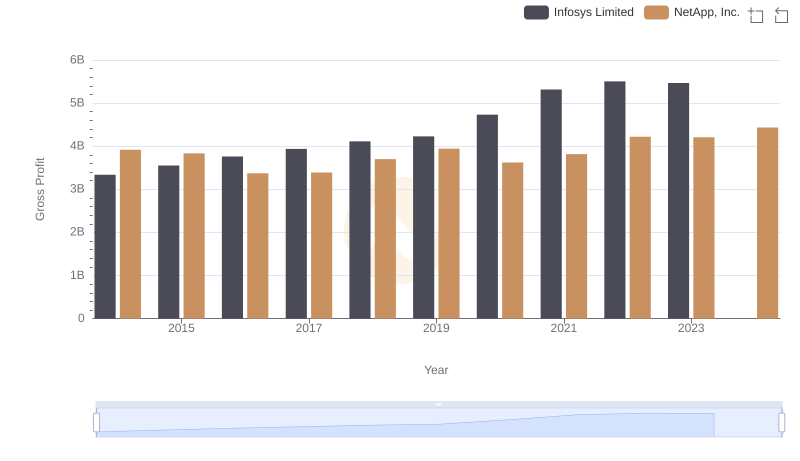
Gross Profit Analysis: Comparing Infosys Limited and NetApp, Inc.
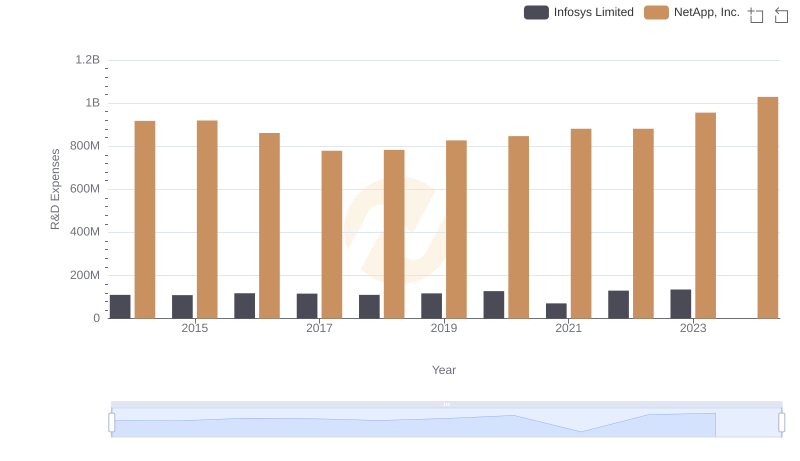
Analyzing R&D Budgets: Infosys Limited vs NetApp, Inc.
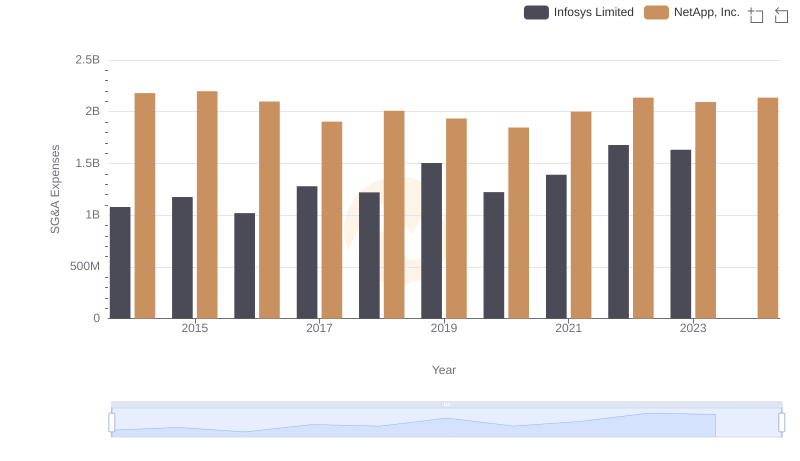
Who Optimizes SG&A Costs Better? Infosys Limited or NetApp, Inc.
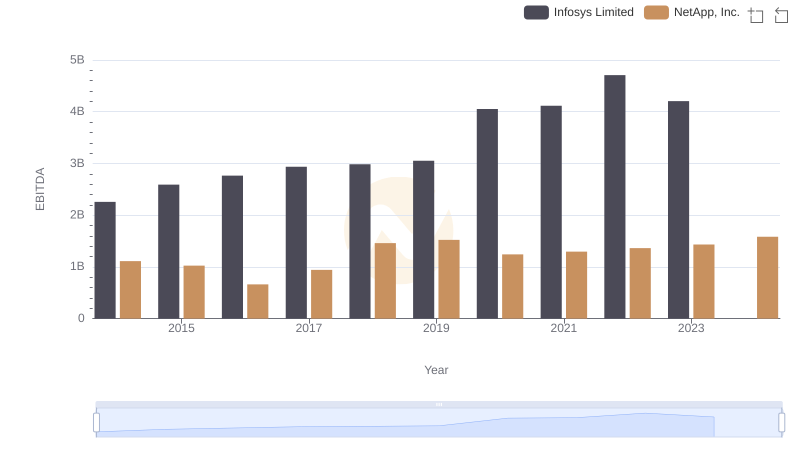
EBITDA Performance Review: Infosys Limited vs NetApp, Inc.