| __timestamp | Infosys Limited | PTC Inc. |
|---|---|---|
| Wednesday, January 1, 2014 | 2258000000 | 271574000 |
| Thursday, January 1, 2015 | 2590000000 | 125699999 |
| Friday, January 1, 2016 | 2765000000 | 49244000 |
| Sunday, January 1, 2017 | 2936000000 | 127736000 |
| Monday, January 1, 2018 | 2984000000 | 157737000 |
| Tuesday, January 1, 2019 | 3053000000 | 141171000 |
| Wednesday, January 1, 2020 | 4053342784 | 291951000 |
| Friday, January 1, 2021 | 4116000000 | 564767000 |
| Saturday, January 1, 2022 | 4707334610 | 573406000 |
| Sunday, January 1, 2023 | 4206000000 | 599145000 |
| Monday, January 1, 2024 | 730022000 |
Unveiling the hidden dimensions of data
In the ever-evolving landscape of global technology, the financial health of companies is a key indicator of their market prowess. This analysis delves into the EBITDA performance of two tech giants, Infosys Limited and PTC Inc., from 2014 to 2023. Over this period, Infosys Limited has demonstrated a robust growth trajectory, with its EBITDA increasing by approximately 86%, peaking in 2022. In contrast, PTC Inc. has shown a more modest growth of around 170%, albeit from a smaller base, reflecting its dynamic adaptation in the tech sector. Notably, Infosys consistently outperformed PTC in absolute EBITDA figures, underscoring its dominant market position. However, the data for 2024 is incomplete, leaving room for speculation on future trends. This side-by-side analysis offers a compelling glimpse into the financial strategies and market adaptability of these two industry leaders.
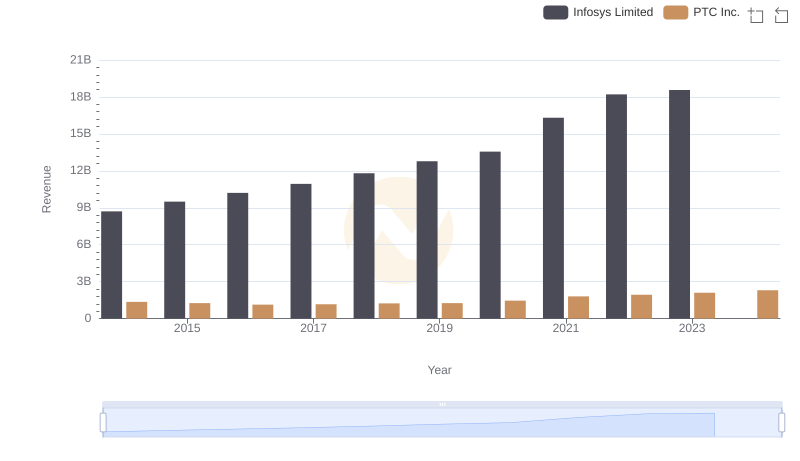
Who Generates More Revenue? Infosys Limited or PTC Inc.
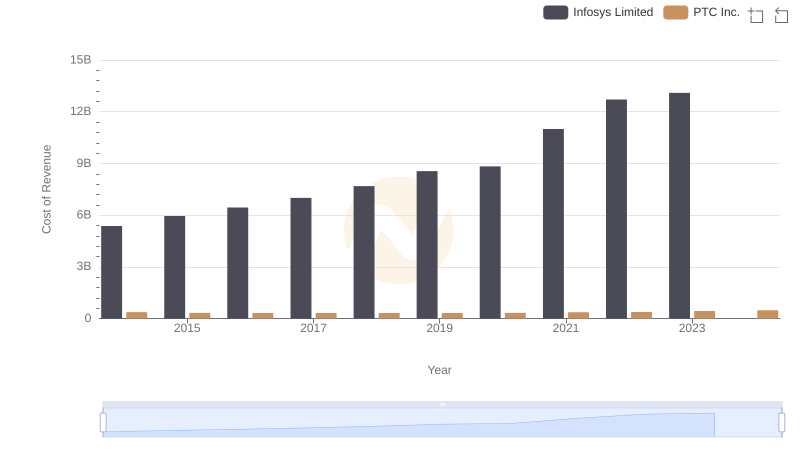
Cost of Revenue Comparison: Infosys Limited vs PTC Inc.

Infosys Limited vs PTC Inc.: A Gross Profit Performance Breakdown
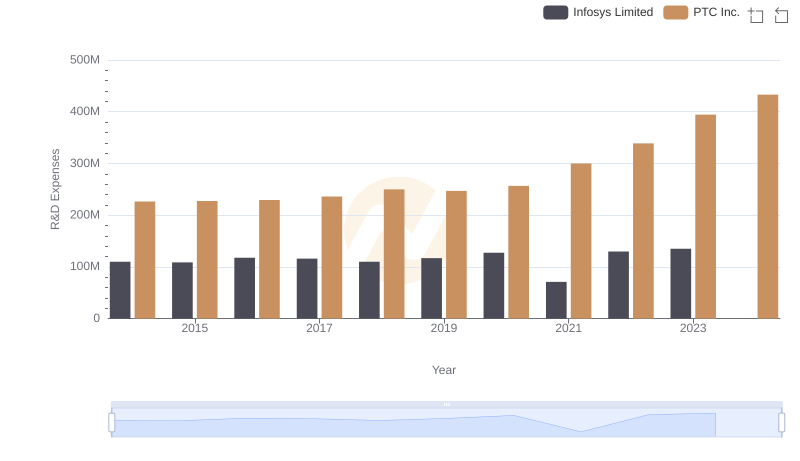
Research and Development: Comparing Key Metrics for Infosys Limited and PTC Inc.
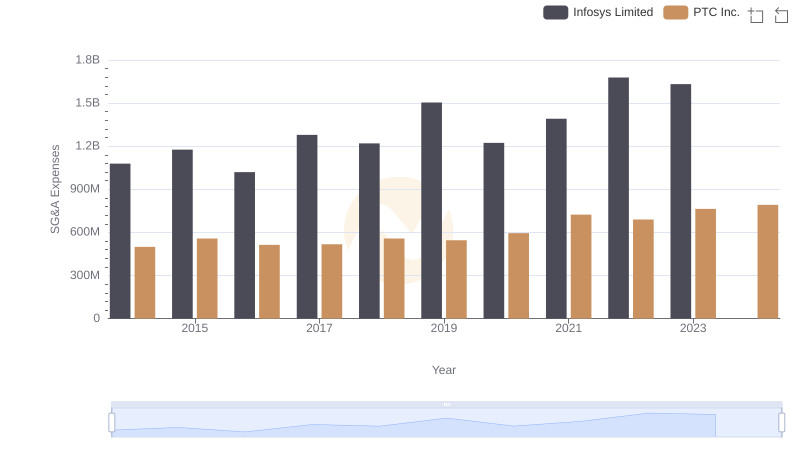
Infosys Limited or PTC Inc.: Who Manages SG&A Costs Better?
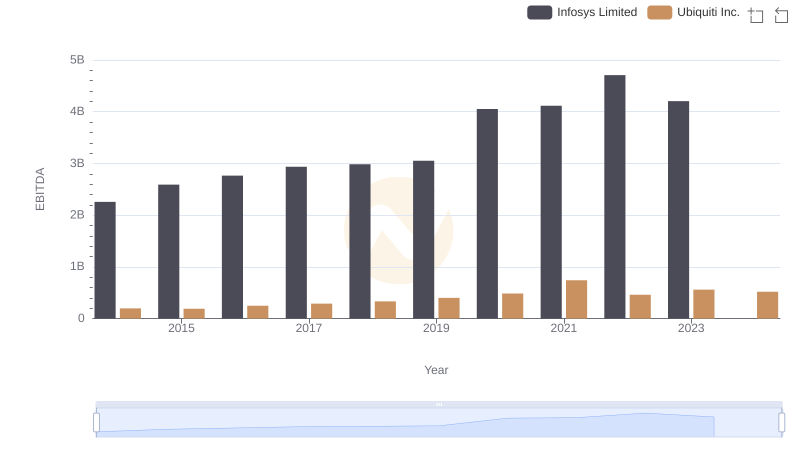
A Professional Review of EBITDA: Infosys Limited Compared to Ubiquiti Inc.
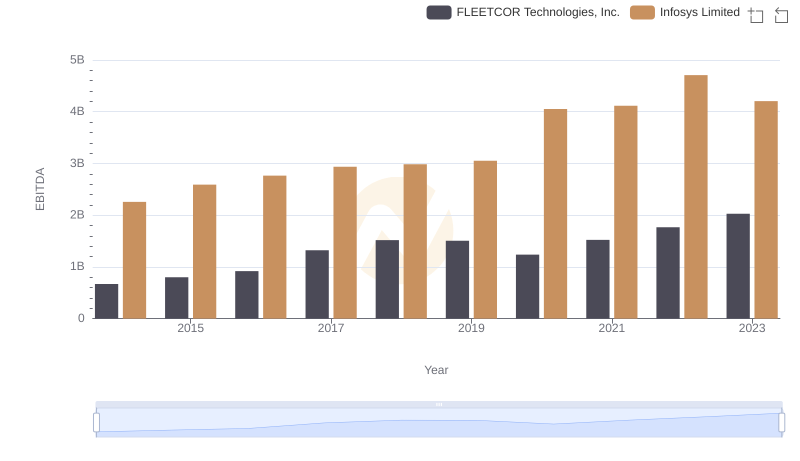
Infosys Limited and FLEETCOR Technologies, Inc.: A Detailed Examination of EBITDA Performance

A Professional Review of EBITDA: Infosys Limited Compared to ON Semiconductor Corporation
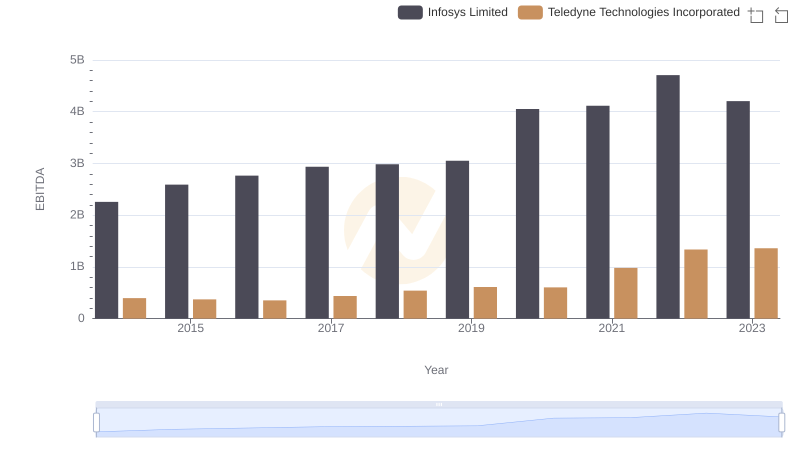
EBITDA Performance Review: Infosys Limited vs Teledyne Technologies Incorporated
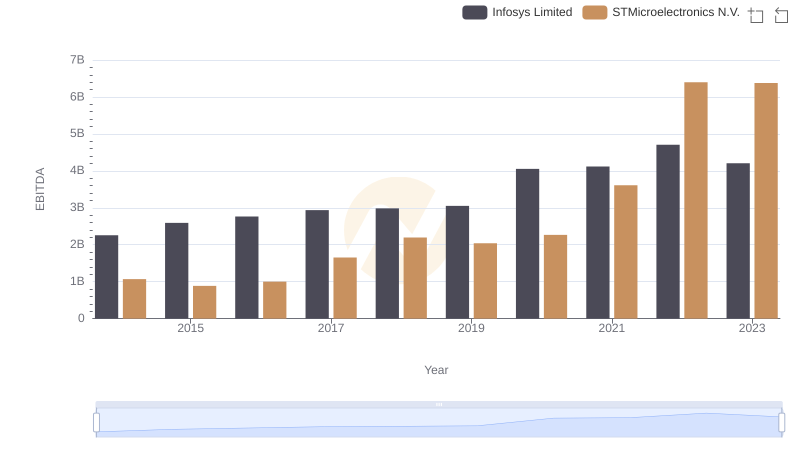
Professional EBITDA Benchmarking: Infosys Limited vs STMicroelectronics N.V.
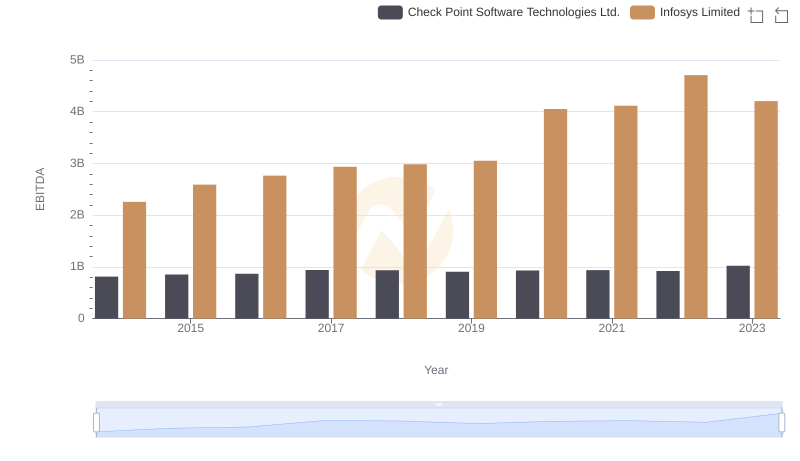
EBITDA Analysis: Evaluating Infosys Limited Against Check Point Software Technologies Ltd.
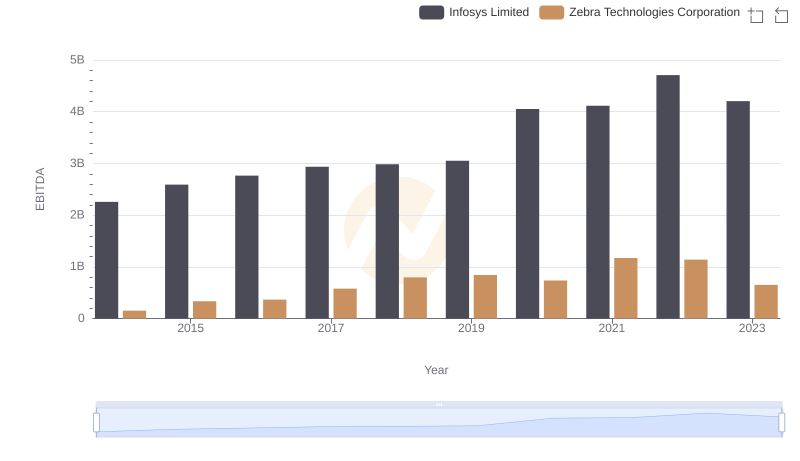
Comprehensive EBITDA Comparison: Infosys Limited vs Zebra Technologies Corporation