| __timestamp | Infosys Limited | NetApp, Inc. |
|---|---|---|
| Wednesday, January 1, 2014 | 3337000000 | 3919100000 |
| Thursday, January 1, 2015 | 3551000000 | 3833200000 |
| Friday, January 1, 2016 | 3762000000 | 3373000000 |
| Sunday, January 1, 2017 | 3938000000 | 3390000000 |
| Monday, January 1, 2018 | 4112000000 | 3699000000 |
| Tuesday, January 1, 2019 | 4228000000 | 3945000000 |
| Wednesday, January 1, 2020 | 4733000000 | 3623000000 |
| Friday, January 1, 2021 | 5315000000 | 3815000000 |
| Saturday, January 1, 2022 | 5503000000 | 4220000000 |
| Sunday, January 1, 2023 | 5466000000 | 4209000000 |
| Monday, January 1, 2024 | 4433000000 |
Cracking the code
In the ever-evolving landscape of global technology, the financial performance of industry giants like Infosys Limited and NetApp, Inc. offers a fascinating glimpse into their strategic prowess. Over the past decade, Infosys has demonstrated a robust growth trajectory, with its gross profit surging by approximately 64% from 2014 to 2023. This upward trend underscores Infosys's ability to adapt and thrive in a competitive market.
Conversely, NetApp, Inc. has shown a more stable yet modest growth pattern, with its gross profit increasing by around 7% over the same period. Notably, 2024 data for Infosys is missing, which could provide further insights into its financial health. As we delve into these figures, it becomes evident that while both companies are formidable players, their financial strategies and market responses differ significantly, offering valuable lessons for investors and industry analysts alike.
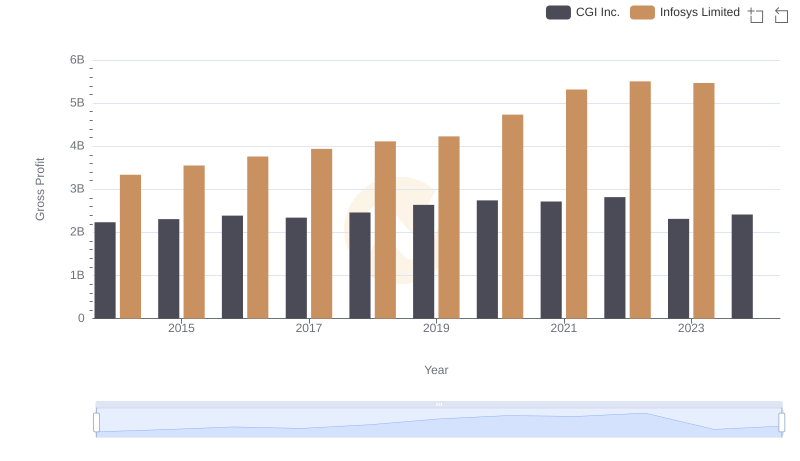
Gross Profit Comparison: Infosys Limited and CGI Inc. Trends
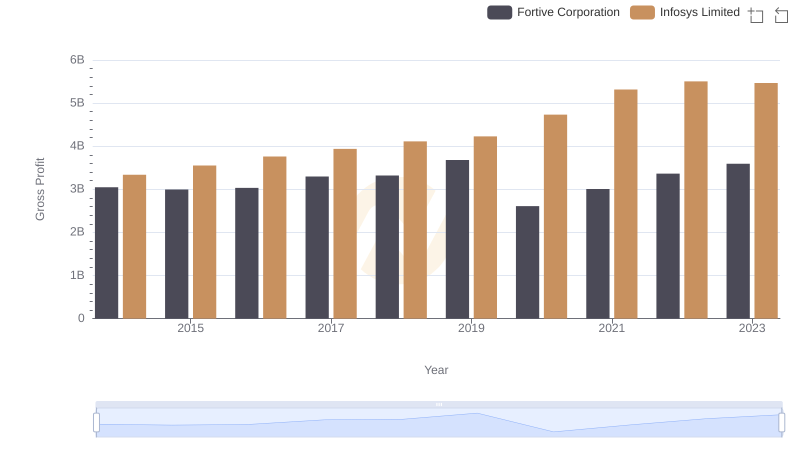
Infosys Limited and Fortive Corporation: A Detailed Gross Profit Analysis
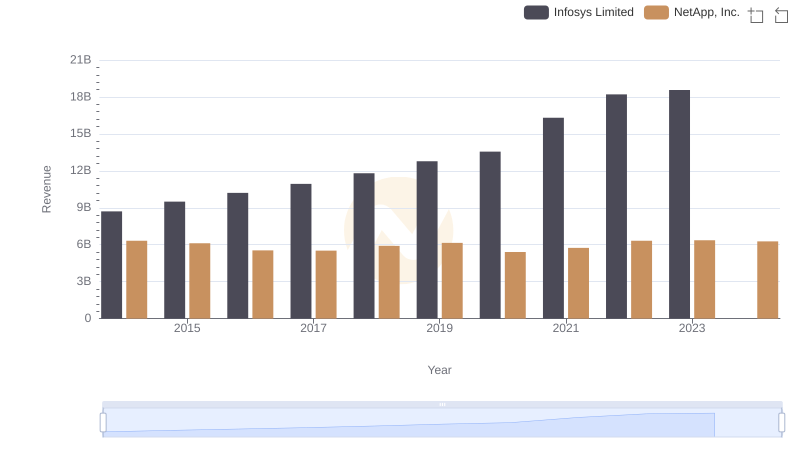
Annual Revenue Comparison: Infosys Limited vs NetApp, Inc.
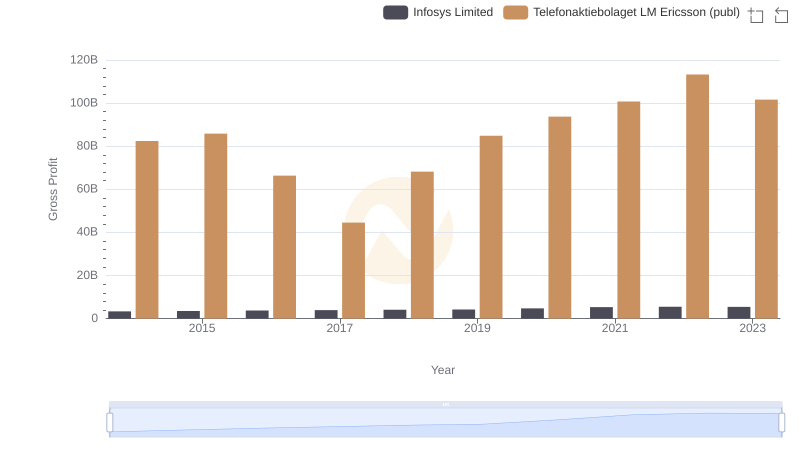
Who Generates Higher Gross Profit? Infosys Limited or Telefonaktiebolaget LM Ericsson (publ)
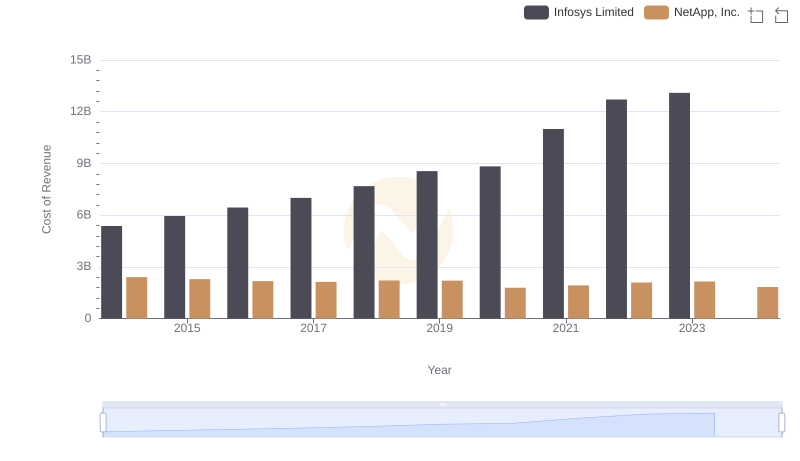
Cost of Revenue Comparison: Infosys Limited vs NetApp, Inc.
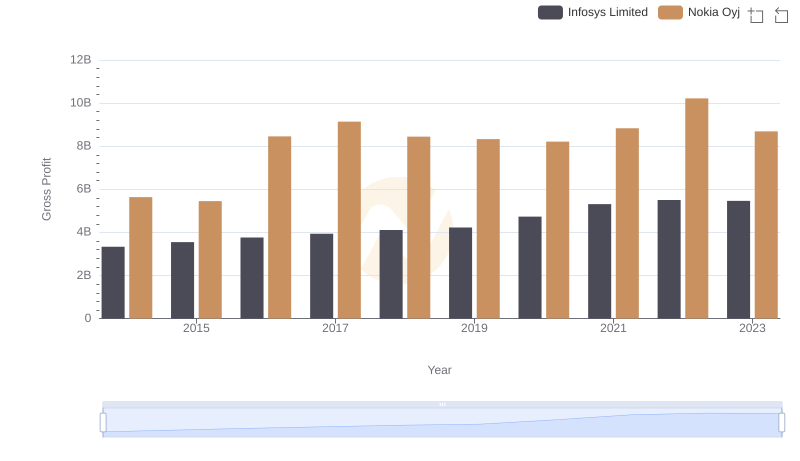
Key Insights on Gross Profit: Infosys Limited vs Nokia Oyj
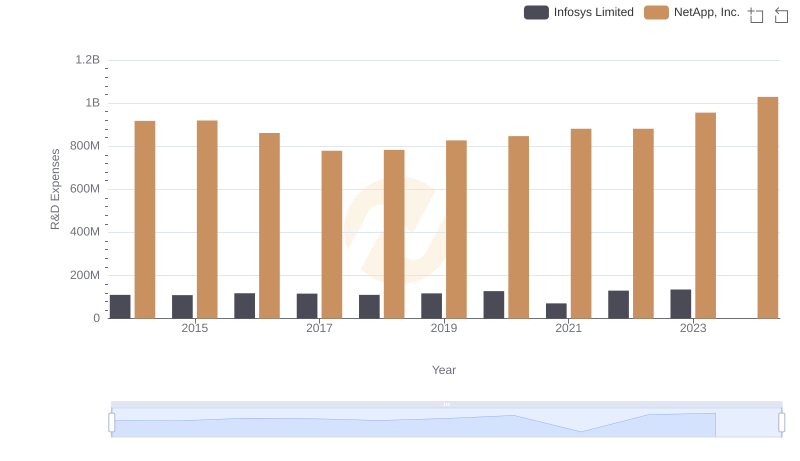
Analyzing R&D Budgets: Infosys Limited vs NetApp, Inc.
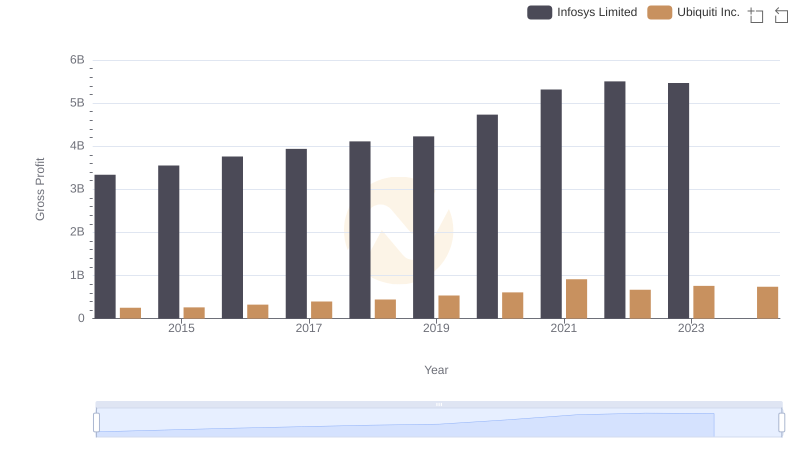
Key Insights on Gross Profit: Infosys Limited vs Ubiquiti Inc.

Infosys Limited vs PTC Inc.: A Gross Profit Performance Breakdown
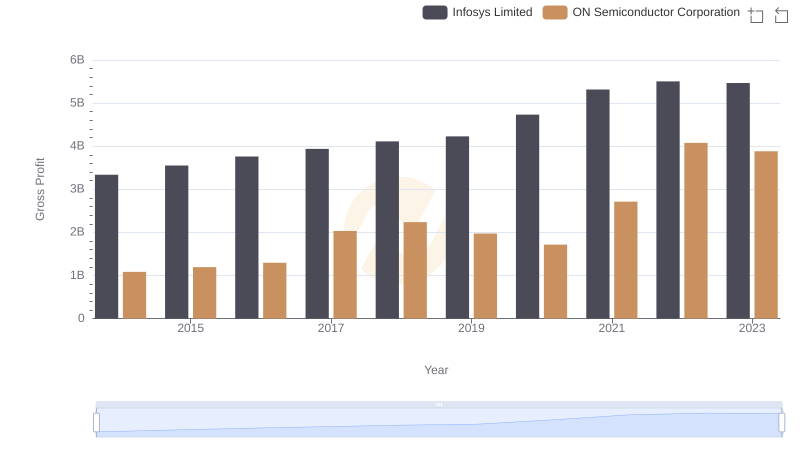
Gross Profit Trends Compared: Infosys Limited vs ON Semiconductor Corporation
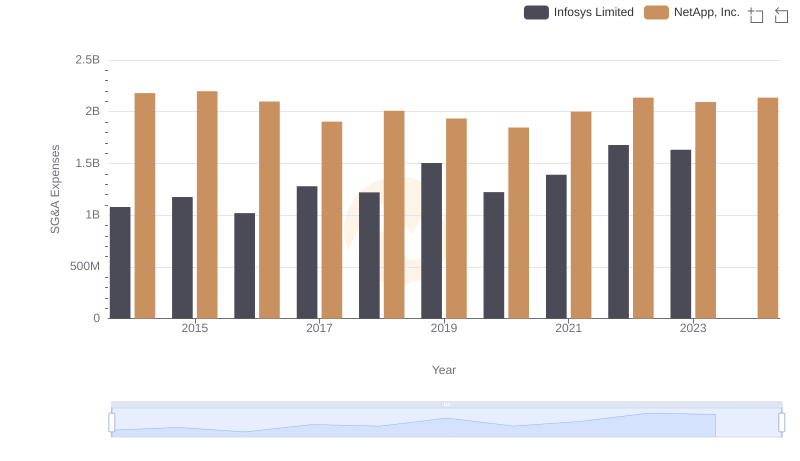
Who Optimizes SG&A Costs Better? Infosys Limited or NetApp, Inc.
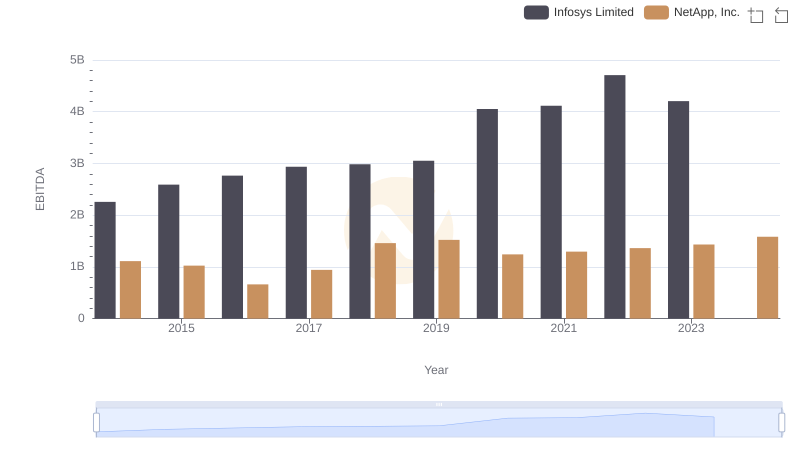
EBITDA Performance Review: Infosys Limited vs NetApp, Inc.