| __timestamp | Cisco Systems, Inc. | International Business Machines Corporation |
|---|---|---|
| Wednesday, January 1, 2014 | 12709000000 | 24962000000 |
| Thursday, January 1, 2015 | 14209000000 | 20268000000 |
| Friday, January 1, 2016 | 15678000000 | 17341000000 |
| Sunday, January 1, 2017 | 15383000000 | 16556000000 |
| Monday, January 1, 2018 | 16172000000 | 16545000000 |
| Tuesday, January 1, 2019 | 17334000000 | 14609000000 |
| Wednesday, January 1, 2020 | 16363000000 | 10555000000 |
| Friday, January 1, 2021 | 15558000000 | 12409000000 |
| Saturday, January 1, 2022 | 16794000000 | 7174000000 |
| Sunday, January 1, 2023 | 17471000000 | 14693000000 |
| Monday, January 1, 2024 | 15747000000 | 6015000000 |
Unleashing insights
In the ever-evolving tech landscape, Cisco Systems, Inc. and International Business Machines Corporation (IBM) have been pivotal players. From 2014 to 2024, their EBITDA performance reveals intriguing trends. Cisco's EBITDA grew by approximately 38%, peaking in 2023, while IBM's EBITDA saw a significant decline of around 76% over the same period. This divergence highlights Cisco's robust growth strategy and IBM's challenges in adapting to market shifts. Notably, Cisco's EBITDA surpassed IBM's consistently from 2019 onwards, marking a strategic shift in the tech industry. As we look to the future, these trends underscore the importance of innovation and adaptability in maintaining competitive advantage. The data also suggests potential opportunities for investors and stakeholders to reassess their strategies in the tech sector. Missing data for 2024 indicates ongoing developments, making it a year to watch closely.
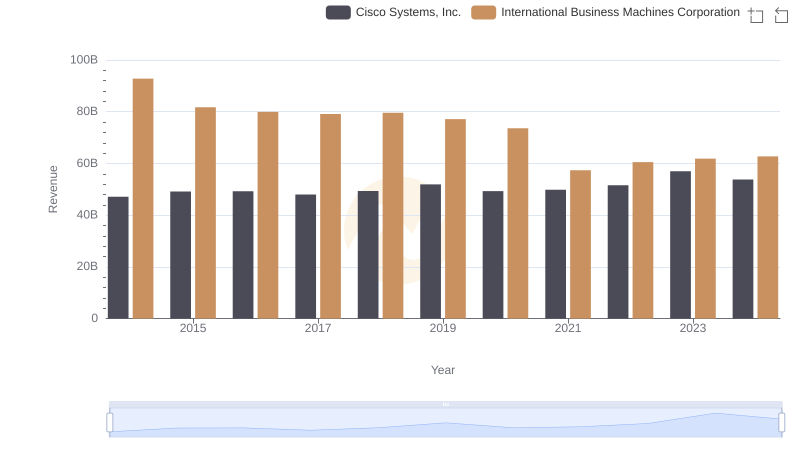
Breaking Down Revenue Trends: Cisco Systems, Inc. vs International Business Machines Corporation
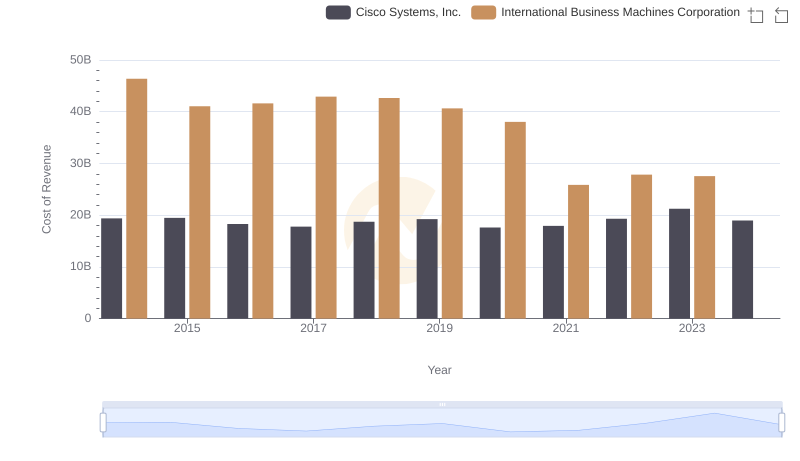
Cost Insights: Breaking Down Cisco Systems, Inc. and International Business Machines Corporation's Expenses
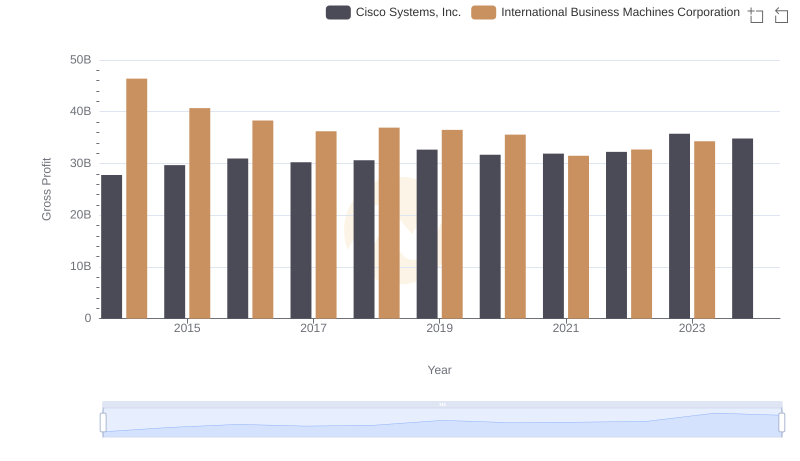
Key Insights on Gross Profit: Cisco Systems, Inc. vs International Business Machines Corporation
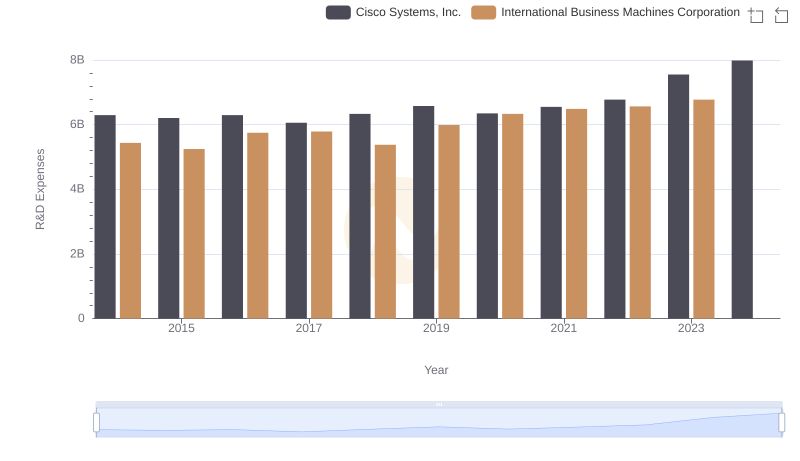
Research and Development Investment: Cisco Systems, Inc. vs International Business Machines Corporation
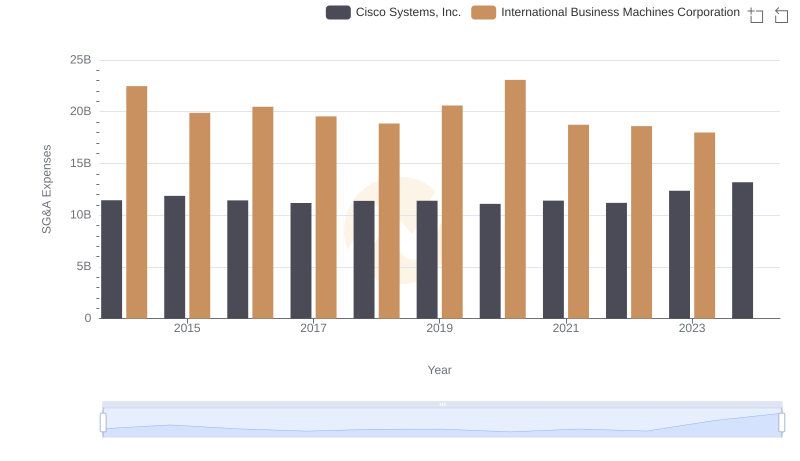
Breaking Down SG&A Expenses: Cisco Systems, Inc. vs International Business Machines Corporation
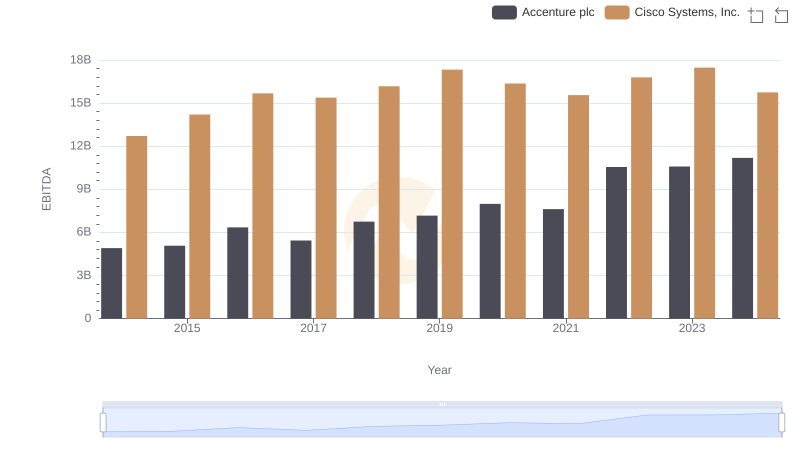
Cisco Systems, Inc. vs Accenture plc: In-Depth EBITDA Performance Comparison
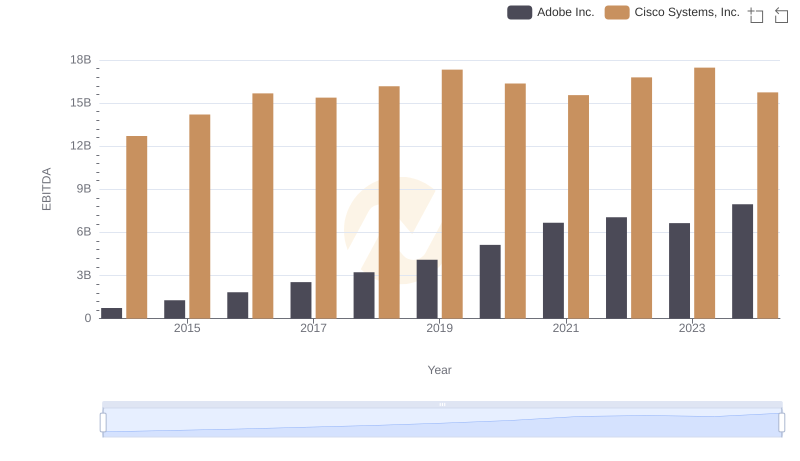
A Professional Review of EBITDA: Cisco Systems, Inc. Compared to Adobe Inc.
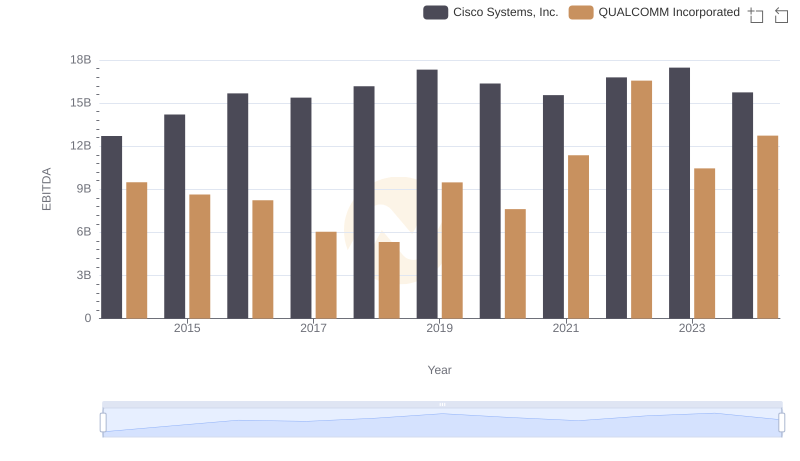
Cisco Systems, Inc. and QUALCOMM Incorporated: A Detailed Examination of EBITDA Performance
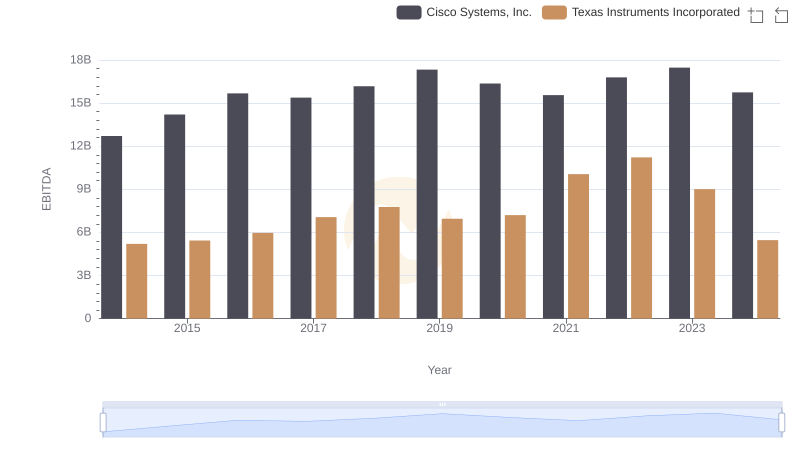
Cisco Systems, Inc. vs Texas Instruments Incorporated: In-Depth EBITDA Performance Comparison
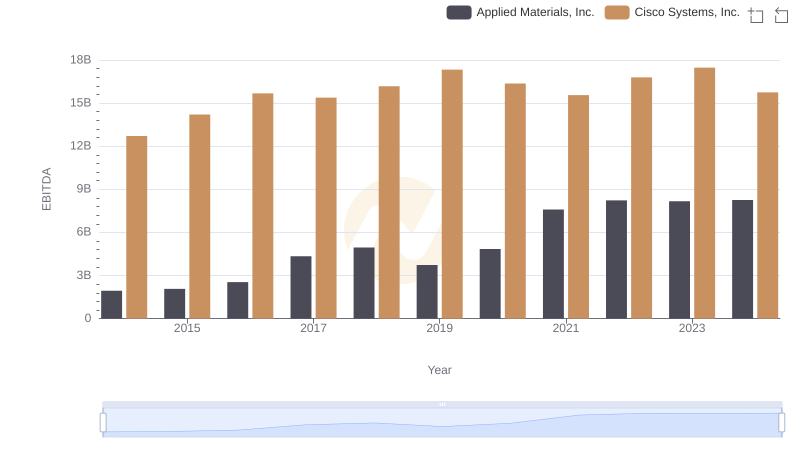
EBITDA Performance Review: Cisco Systems, Inc. vs Applied Materials, Inc.
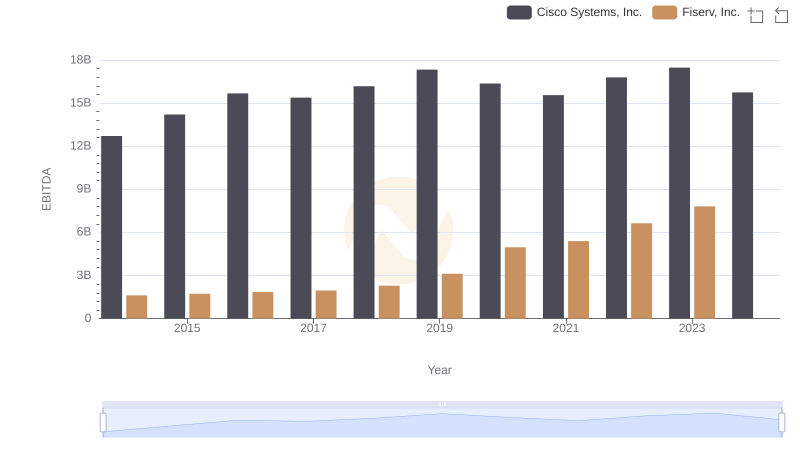
EBITDA Analysis: Evaluating Cisco Systems, Inc. Against Fiserv, Inc.
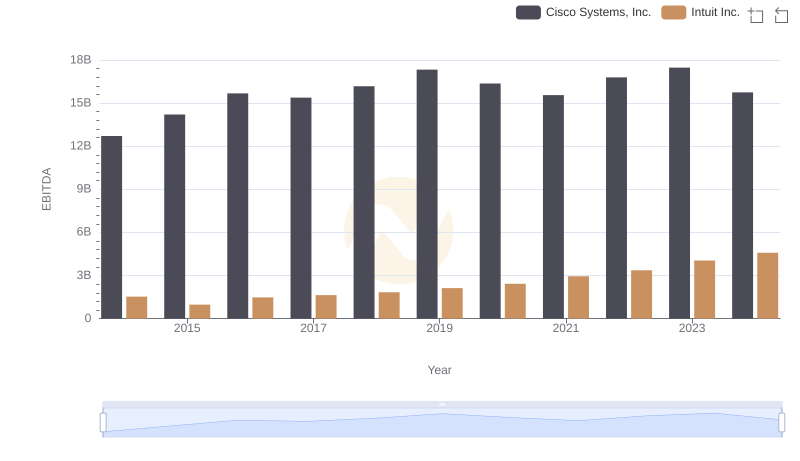
Cisco Systems, Inc. vs Intuit Inc.: In-Depth EBITDA Performance Comparison