| __timestamp | Eaton Corporation plc | Waste Connections, Inc. |
|---|---|---|
| Wednesday, January 1, 2014 | 3586000000 | 717805000 |
| Thursday, January 1, 2015 | 3302000000 | 191002871 |
| Friday, January 1, 2016 | 3176000000 | 900371894 |
| Sunday, January 1, 2017 | 3418000000 | 1380632000 |
| Monday, January 1, 2018 | 3875000000 | 1442229014 |
| Tuesday, January 1, 2019 | 2827000000 | 1650754605 |
| Wednesday, January 1, 2020 | 1674000000 | 1597555000 |
| Friday, January 1, 2021 | 2423000000 | 1891001000 |
| Saturday, January 1, 2022 | 3031000000 | 2090554149 |
| Sunday, January 1, 2023 | 4904000000 | 2261354000 |
| Monday, January 1, 2024 | 5547999771 | 2389779000 |
Igniting the spark of knowledge
In the ever-evolving landscape of industrial and waste management sectors, Eaton Corporation plc and Waste Connections, Inc. have demonstrated remarkable EBITDA growth over the past decade. From 2014 to 2023, Eaton's EBITDA surged by approximately 37%, peaking in 2023 with a notable increase to $4.9 billion. This growth reflects Eaton's strategic innovations and market adaptability.
Conversely, Waste Connections, Inc. showcased a robust upward trajectory, with its EBITDA more than tripling from 2014 to 2023, reaching $2.3 billion. This impressive growth underscores the company's expanding footprint in the waste management industry.
Both companies have navigated economic fluctuations, with Eaton experiencing a dip in 2020, likely due to global disruptions, while Waste Connections maintained a steady climb. This analysis highlights the resilience and strategic prowess of these industry leaders, offering valuable insights for investors and market analysts.
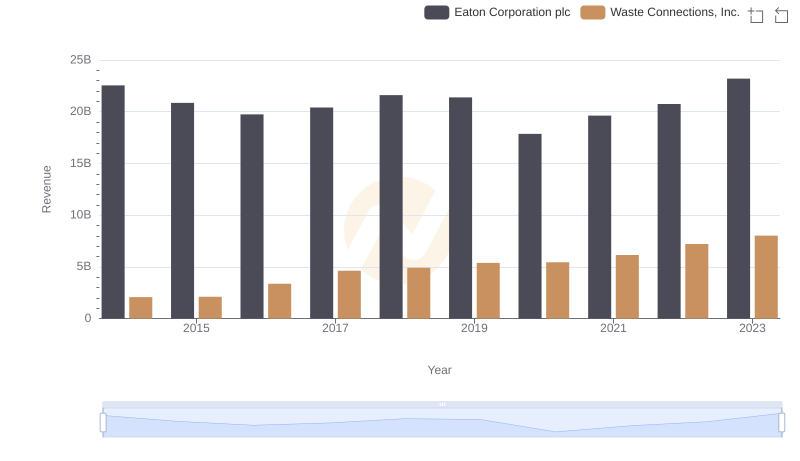
Who Generates More Revenue? Eaton Corporation plc or Waste Connections, Inc.

Eaton Corporation plc and Waste Connections, Inc.: A Detailed Gross Profit Analysis
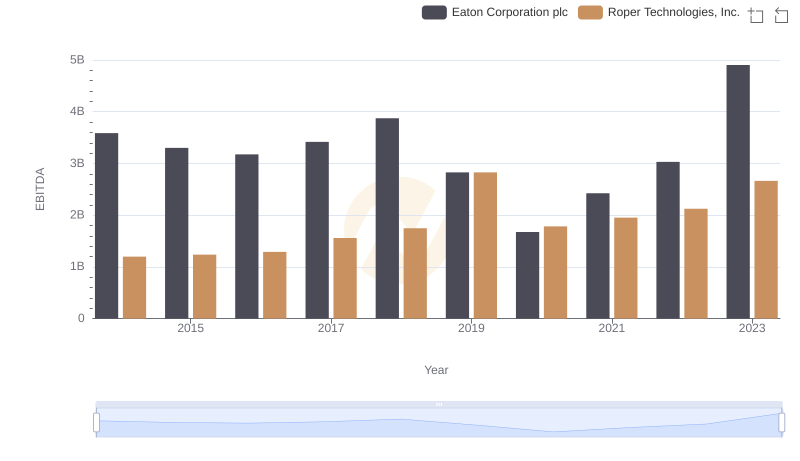
A Professional Review of EBITDA: Eaton Corporation plc Compared to Roper Technologies, Inc.
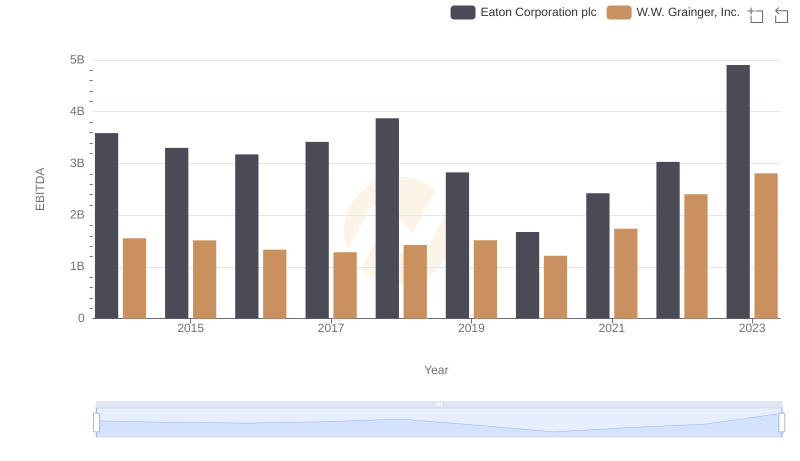
Professional EBITDA Benchmarking: Eaton Corporation plc vs W.W. Grainger, Inc.
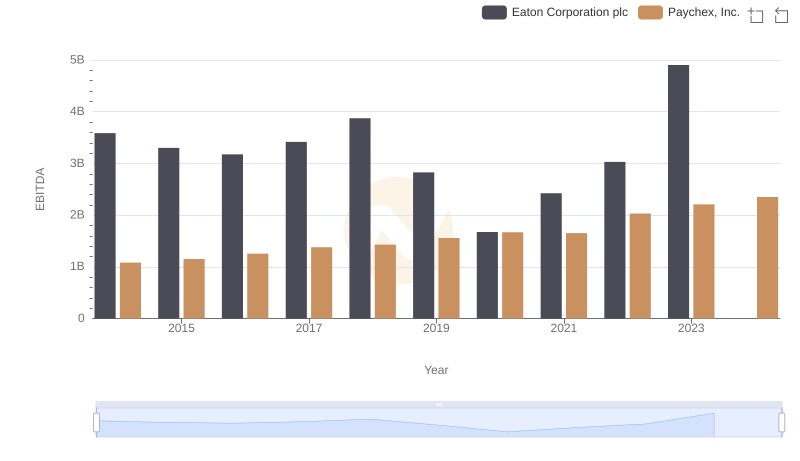
Comprehensive EBITDA Comparison: Eaton Corporation plc vs Paychex, Inc.
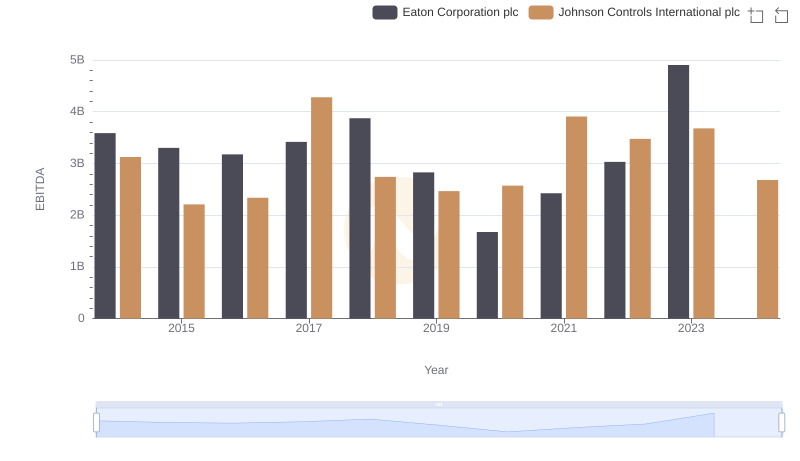
Professional EBITDA Benchmarking: Eaton Corporation plc vs Johnson Controls International plc
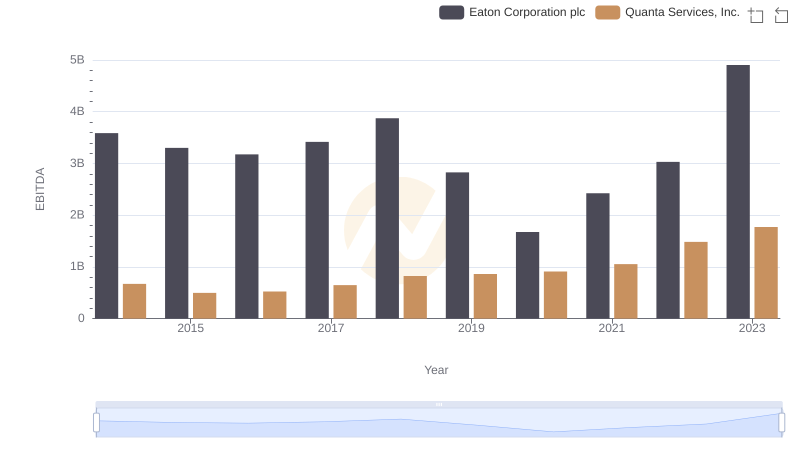
EBITDA Performance Review: Eaton Corporation plc vs Quanta Services, Inc.