| __timestamp | Eaton Corporation plc | Johnson Controls International plc |
|---|---|---|
| Wednesday, January 1, 2014 | 3586000000 | 3125000000 |
| Thursday, January 1, 2015 | 3302000000 | 2209000000 |
| Friday, January 1, 2016 | 3176000000 | 2338000000 |
| Sunday, January 1, 2017 | 3418000000 | 4280000000 |
| Monday, January 1, 2018 | 3875000000 | 2741000000 |
| Tuesday, January 1, 2019 | 2827000000 | 2466000000 |
| Wednesday, January 1, 2020 | 1674000000 | 2572000000 |
| Friday, January 1, 2021 | 2423000000 | 3907000000 |
| Saturday, January 1, 2022 | 3031000000 | 3474000000 |
| Sunday, January 1, 2023 | 4904000000 | 3678000000 |
| Monday, January 1, 2024 | 5547999771 | 2800000000 |
Unleashing the power of data
In the competitive landscape of industrial conglomerates, Eaton Corporation plc and Johnson Controls International plc have been pivotal players. Over the past decade, these two companies have showcased fluctuating EBITDA figures, reflecting their strategic maneuvers and market conditions. From 2014 to 2023, Eaton's EBITDA saw a remarkable 37% increase, peaking in 2023, while Johnson Controls experienced a 17% rise, with notable volatility in 2017 and 2021. The year 2020 marked a challenging period for Eaton, with a significant dip, whereas Johnson Controls maintained a steadier course. As of 2023, Eaton's EBITDA outpaced Johnson Controls by approximately 33%, highlighting its robust recovery and strategic positioning. However, the data for 2024 remains incomplete, leaving room for speculation on future trends. This analysis underscores the dynamic nature of the industrial sector and the resilience of these corporate titans.
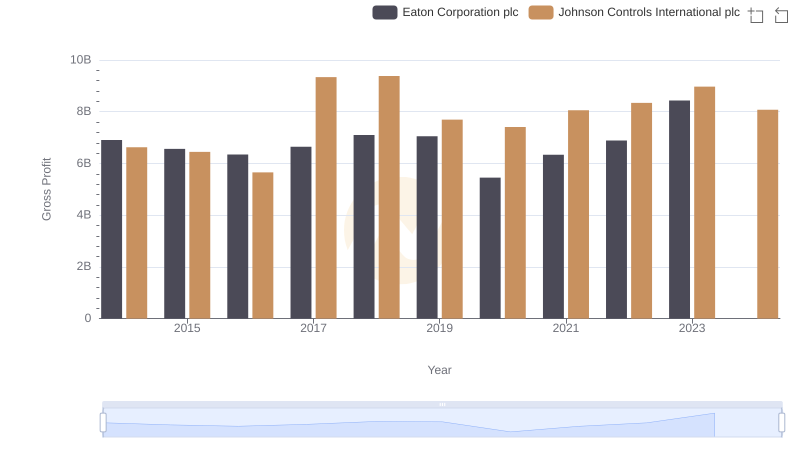
Gross Profit Trends Compared: Eaton Corporation plc vs Johnson Controls International plc
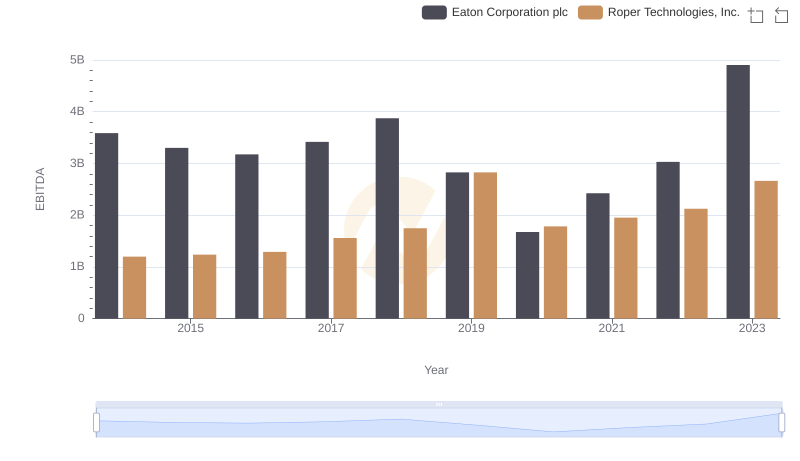
A Professional Review of EBITDA: Eaton Corporation plc Compared to Roper Technologies, Inc.
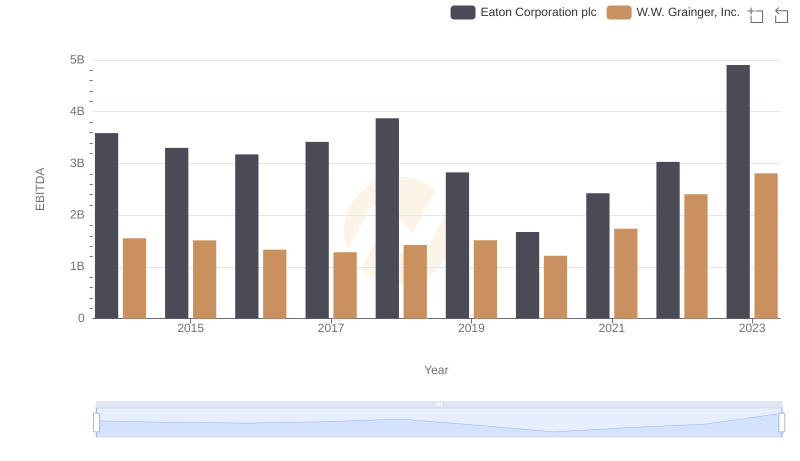
Professional EBITDA Benchmarking: Eaton Corporation plc vs W.W. Grainger, Inc.
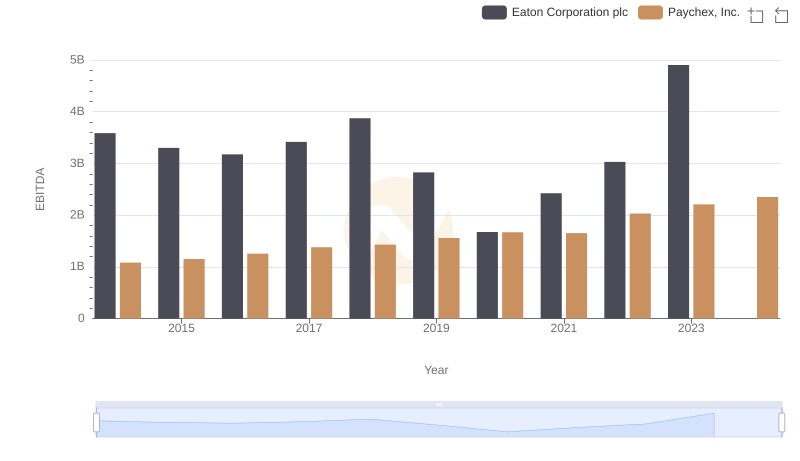
Comprehensive EBITDA Comparison: Eaton Corporation plc vs Paychex, Inc.
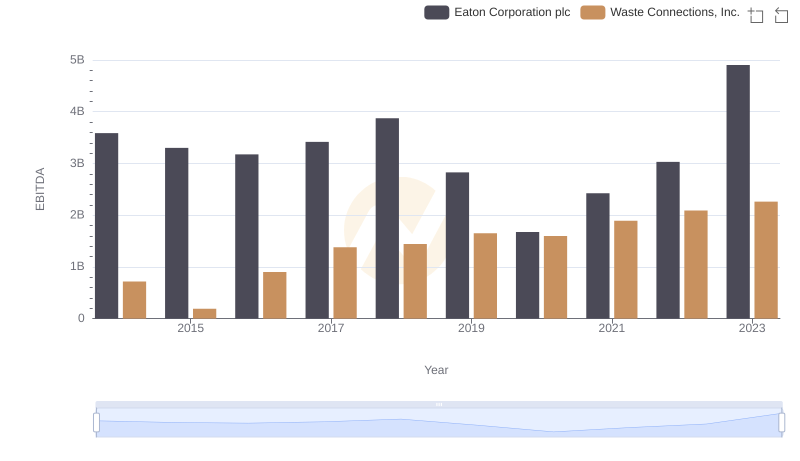
EBITDA Metrics Evaluated: Eaton Corporation plc vs Waste Connections, Inc.
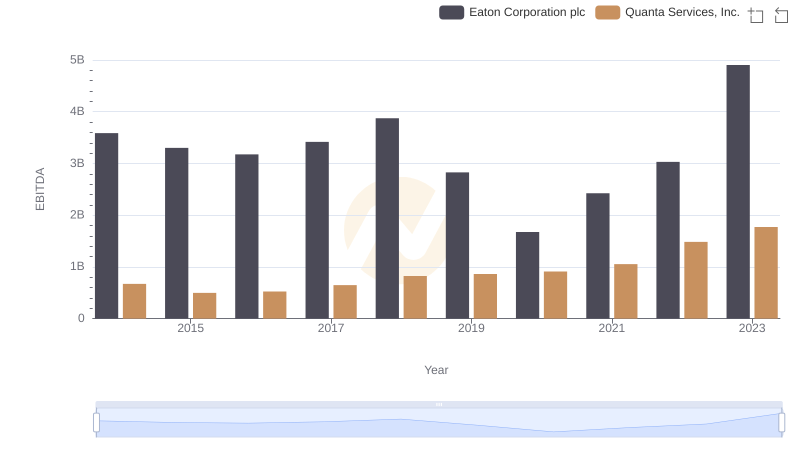
EBITDA Performance Review: Eaton Corporation plc vs Quanta Services, Inc.