| __timestamp | Eaton Corporation plc | Roper Technologies, Inc. |
|---|---|---|
| Wednesday, January 1, 2014 | 3586000000 | 1199557000 |
| Thursday, January 1, 2015 | 3302000000 | 1238079000 |
| Friday, January 1, 2016 | 3176000000 | 1290510000 |
| Sunday, January 1, 2017 | 3418000000 | 1558802000 |
| Monday, January 1, 2018 | 3875000000 | 1746500000 |
| Tuesday, January 1, 2019 | 2827000000 | 2827900000 |
| Wednesday, January 1, 2020 | 1674000000 | 1782800000 |
| Friday, January 1, 2021 | 2423000000 | 1951500000 |
| Saturday, January 1, 2022 | 3031000000 | 2124500000 |
| Sunday, January 1, 2023 | 4904000000 | 2663000000 |
| Monday, January 1, 2024 | 5547999771 | 1996800000 |
Data in motion
In the ever-evolving landscape of industrial technology, Eaton Corporation plc and Roper Technologies, Inc. have emerged as formidable players. Over the past decade, from 2014 to 2023, Eaton's EBITDA has shown a remarkable growth trajectory, peaking at approximately $4.9 billion in 2023, a 37% increase from its 2014 value. In contrast, Roper Technologies, while experiencing a steady rise, reached around $2.7 billion in 2023, marking a 122% increase from its 2014 figure.
This analysis underscores the dynamic nature of the industrial sector, where strategic foresight and adaptability are key to sustained financial performance.
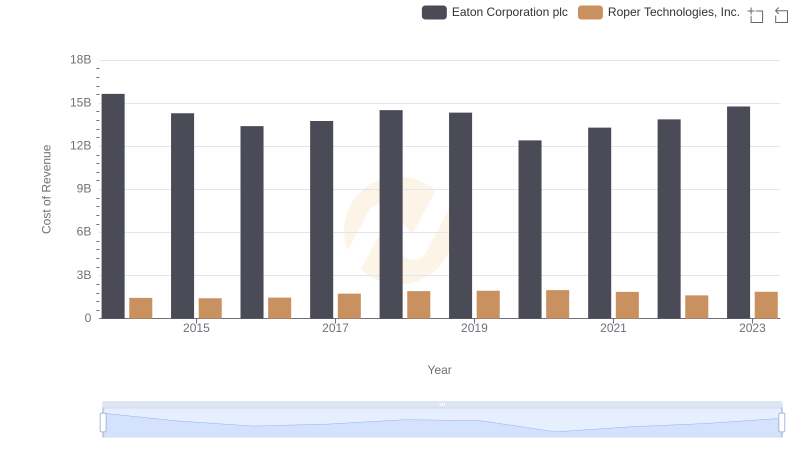
Comparing Cost of Revenue Efficiency: Eaton Corporation plc vs Roper Technologies, Inc.
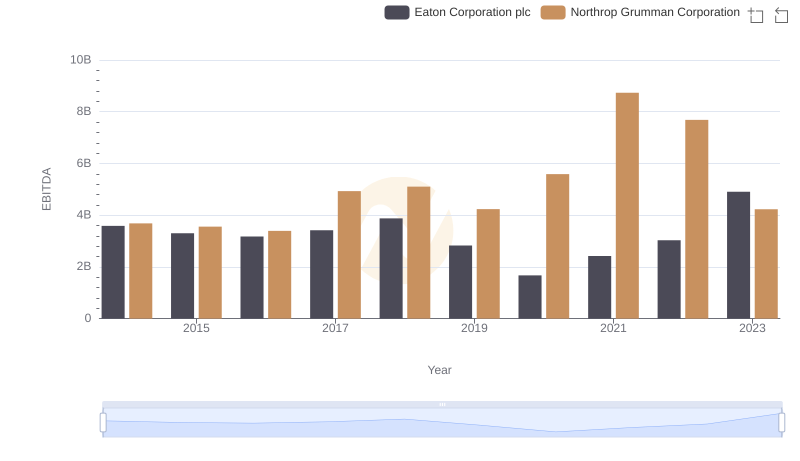
Comprehensive EBITDA Comparison: Eaton Corporation plc vs Northrop Grumman Corporation
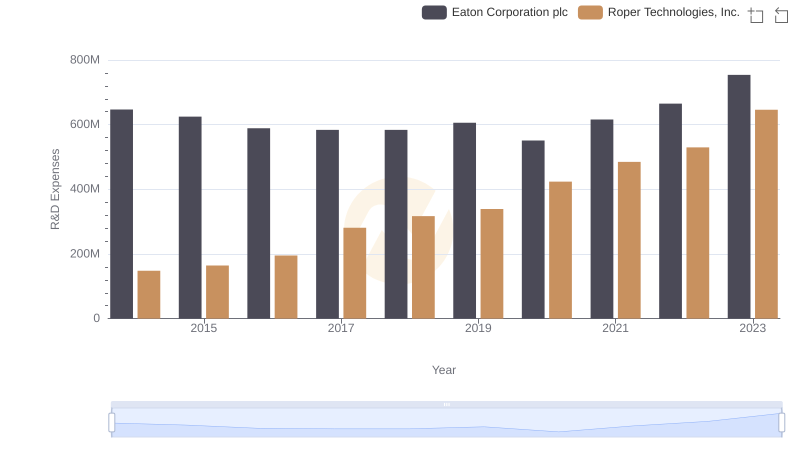
Comparing Innovation Spending: Eaton Corporation plc and Roper Technologies, Inc.
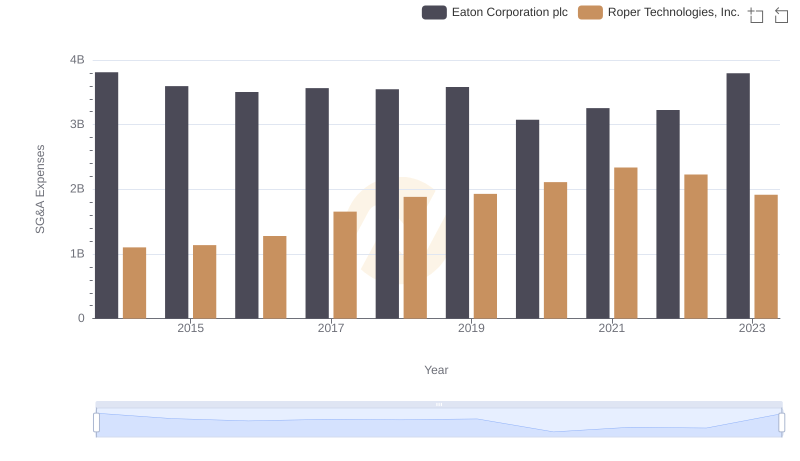
Eaton Corporation plc vs Roper Technologies, Inc.: SG&A Expense Trends
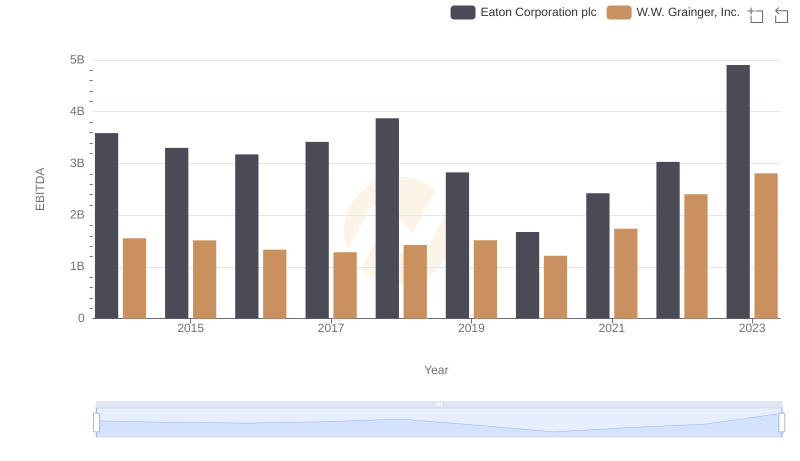
Professional EBITDA Benchmarking: Eaton Corporation plc vs W.W. Grainger, Inc.
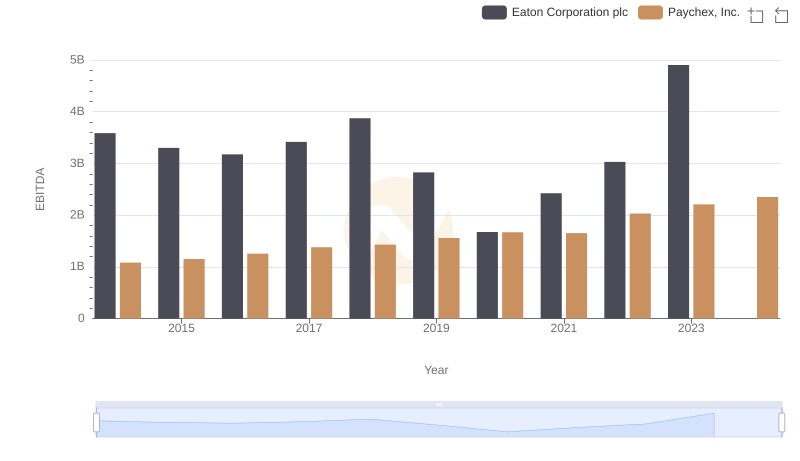
Comprehensive EBITDA Comparison: Eaton Corporation plc vs Paychex, Inc.
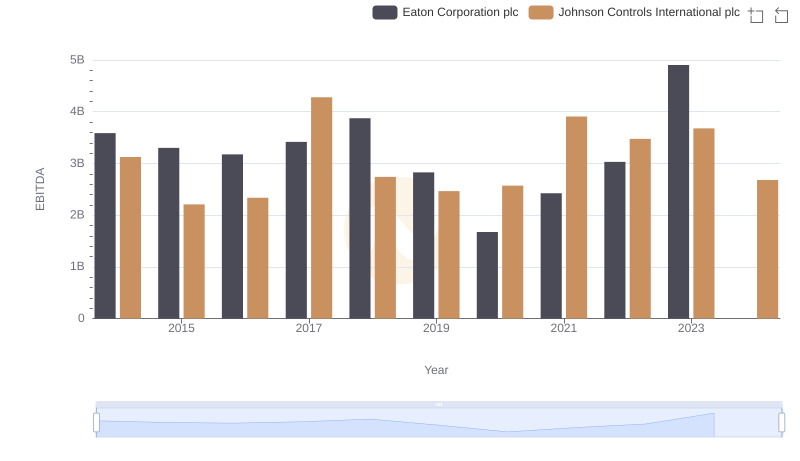
Professional EBITDA Benchmarking: Eaton Corporation plc vs Johnson Controls International plc
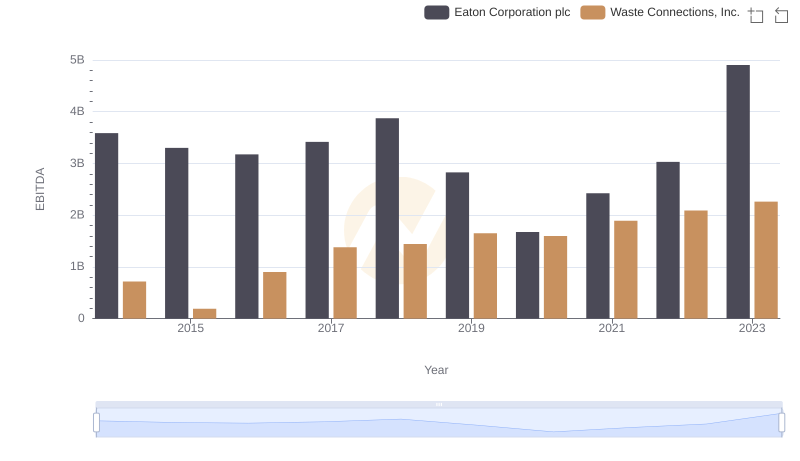
EBITDA Metrics Evaluated: Eaton Corporation plc vs Waste Connections, Inc.