| __timestamp | Eaton Corporation plc | W.W. Grainger, Inc. |
|---|---|---|
| Wednesday, January 1, 2014 | 3586000000 | 1552805000 |
| Thursday, January 1, 2015 | 3302000000 | 1512243000 |
| Friday, January 1, 2016 | 3176000000 | 1334247000 |
| Sunday, January 1, 2017 | 3418000000 | 1284000000 |
| Monday, January 1, 2018 | 3875000000 | 1423000000 |
| Tuesday, January 1, 2019 | 2827000000 | 1516000000 |
| Wednesday, January 1, 2020 | 1674000000 | 1216000000 |
| Friday, January 1, 2021 | 2423000000 | 1738000000 |
| Saturday, January 1, 2022 | 3031000000 | 2404000000 |
| Sunday, January 1, 2023 | 4904000000 | 2807000000 |
| Monday, January 1, 2024 | 5547999771 | 2637000000 |
Igniting the spark of knowledge
In the competitive landscape of industrial giants, Eaton Corporation plc and W.W. Grainger, Inc. have showcased intriguing financial trajectories over the past decade. From 2014 to 2023, Eaton's EBITDA has surged by approximately 37%, peaking at nearly $4.9 billion in 2023. In contrast, Grainger's EBITDA, while more modest, has grown by about 81%, reaching $2.8 billion in the same year. This growth reflects Eaton's robust recovery post-2020, where it rebounded from a low of $1.7 billion, while Grainger steadily climbed from $1.2 billion. The data highlights Eaton's dominance in absolute terms, yet Grainger's impressive growth rate underscores its strategic advancements. As these companies continue to evolve, their financial performance offers valuable insights into the industrial sector's dynamics, making them key players to watch in the coming years.
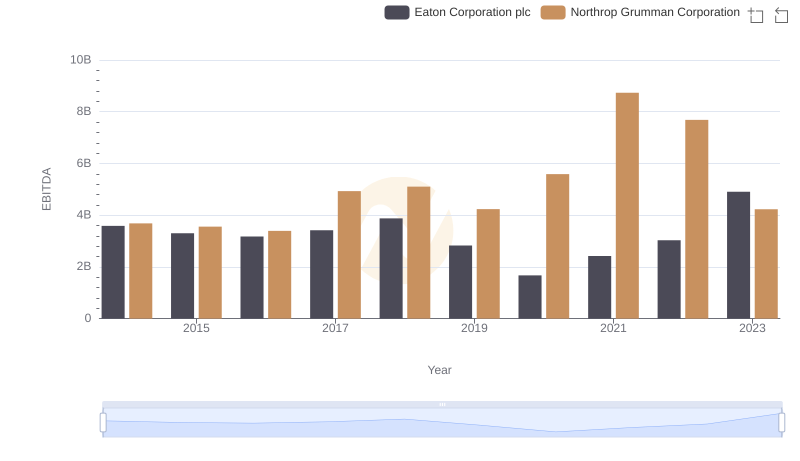
Comprehensive EBITDA Comparison: Eaton Corporation plc vs Northrop Grumman Corporation
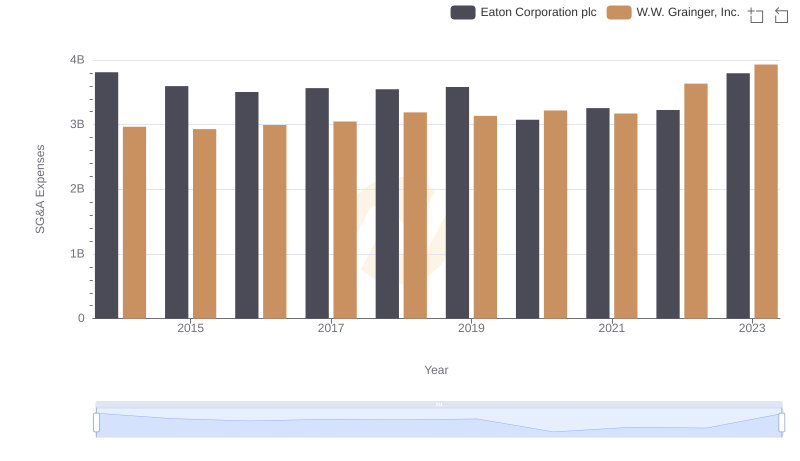
Selling, General, and Administrative Costs: Eaton Corporation plc vs W.W. Grainger, Inc.
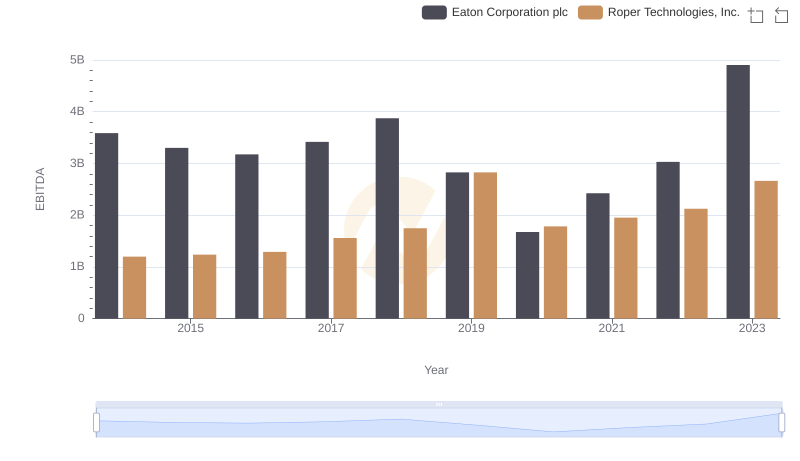
A Professional Review of EBITDA: Eaton Corporation plc Compared to Roper Technologies, Inc.
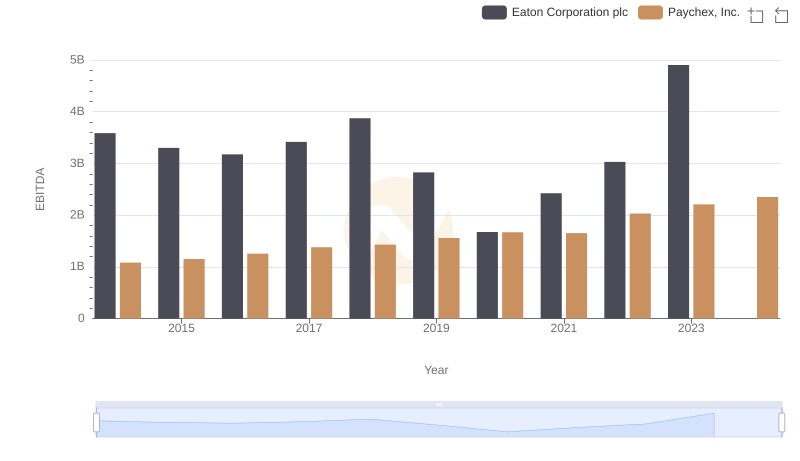
Comprehensive EBITDA Comparison: Eaton Corporation plc vs Paychex, Inc.
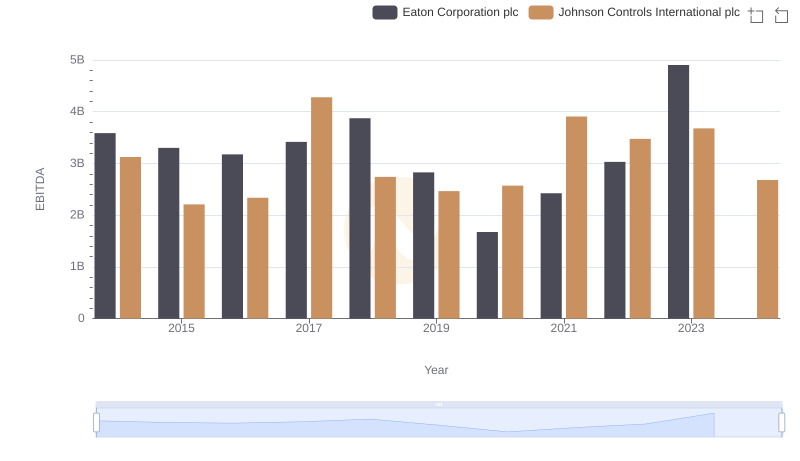
Professional EBITDA Benchmarking: Eaton Corporation plc vs Johnson Controls International plc
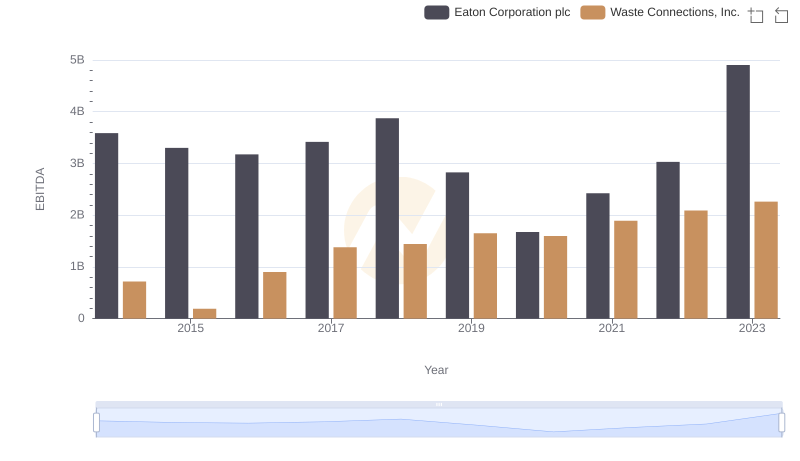
EBITDA Metrics Evaluated: Eaton Corporation plc vs Waste Connections, Inc.
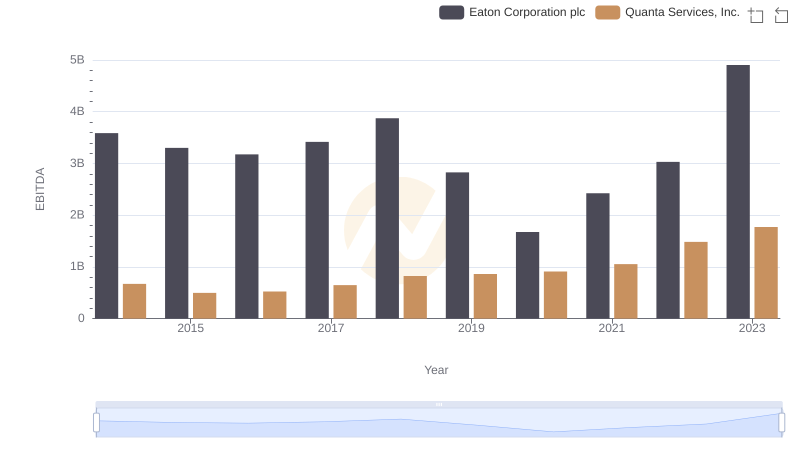
EBITDA Performance Review: Eaton Corporation plc vs Quanta Services, Inc.