| __timestamp | Eaton Corporation plc | Waste Connections, Inc. |
|---|---|---|
| Wednesday, January 1, 2014 | 22552000000 | 2079166000 |
| Thursday, January 1, 2015 | 20855000000 | 2117287000 |
| Friday, January 1, 2016 | 19747000000 | 3375863000 |
| Sunday, January 1, 2017 | 20404000000 | 4630488000 |
| Monday, January 1, 2018 | 21609000000 | 4922941000 |
| Tuesday, January 1, 2019 | 21390000000 | 5388679000 |
| Wednesday, January 1, 2020 | 17858000000 | 5445990000 |
| Friday, January 1, 2021 | 19628000000 | 6151361000 |
| Saturday, January 1, 2022 | 20752000000 | 7211859000 |
| Sunday, January 1, 2023 | 23196000000 | 8021951000 |
| Monday, January 1, 2024 | 24878000000 | 8919591000 |
Igniting the spark of knowledge
In the dynamic world of industrial and waste management sectors, Eaton Corporation plc and Waste Connections, Inc. have been pivotal players. Over the past decade, Eaton has consistently outperformed Waste Connections in terms of revenue generation. From 2014 to 2023, Eaton's revenue grew by approximately 3%, peaking at $23.2 billion in 2023. In contrast, Waste Connections saw a more robust growth of nearly 286%, reaching $8 billion in the same year.
Eaton's revenue dipped in 2020, likely due to global economic disruptions, but rebounded strongly thereafter. Waste Connections, however, demonstrated a steady upward trajectory, reflecting its strategic expansions and acquisitions. This comparison highlights Eaton's dominance in revenue size, while Waste Connections showcases impressive growth potential. As these companies continue to evolve, their financial trajectories offer valuable insights into their strategic priorities and market positioning.
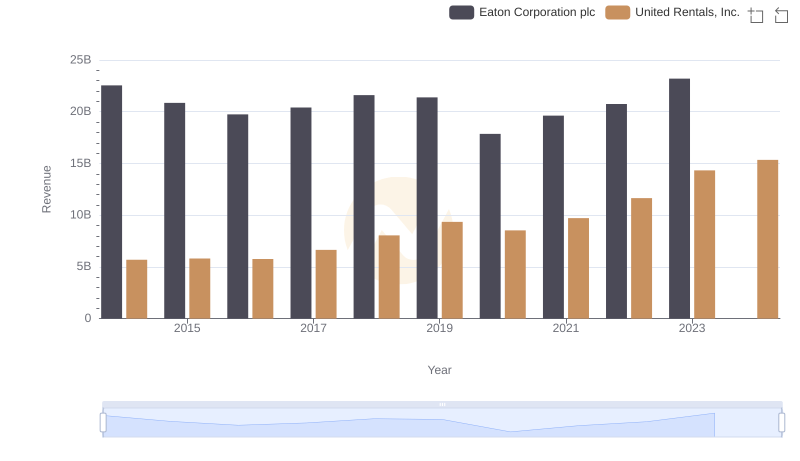
Comparing Revenue Performance: Eaton Corporation plc or United Rentals, Inc.?
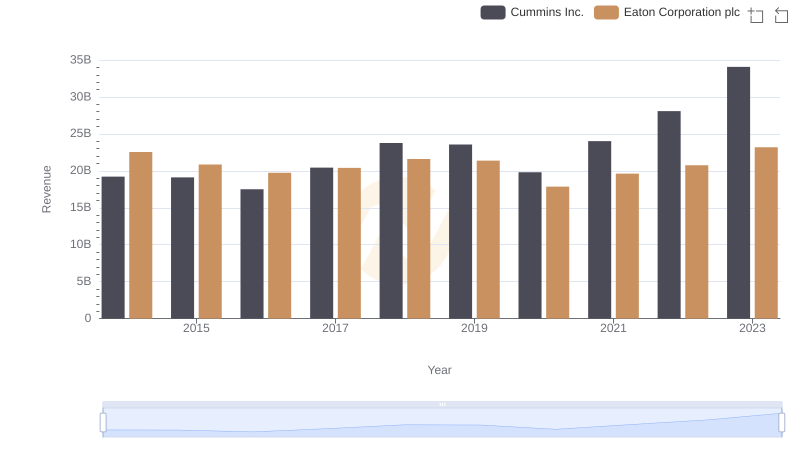
Comparing Revenue Performance: Eaton Corporation plc or Cummins Inc.?
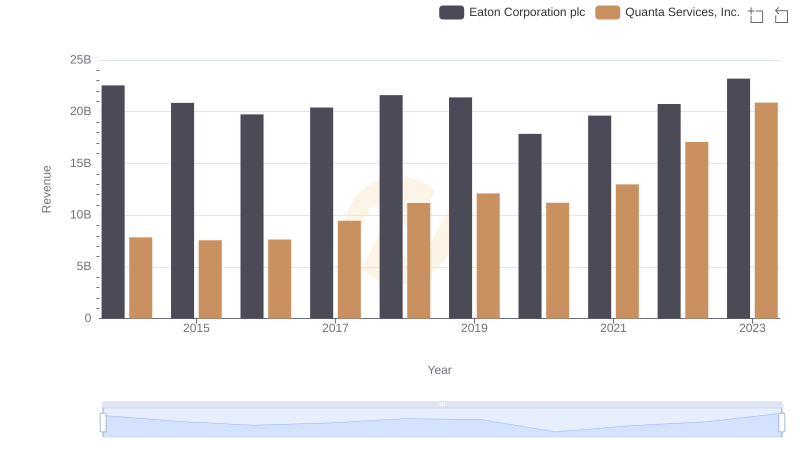
Eaton Corporation plc vs Quanta Services, Inc.: Examining Key Revenue Metrics

Eaton Corporation plc and Waste Connections, Inc.: A Detailed Gross Profit Analysis
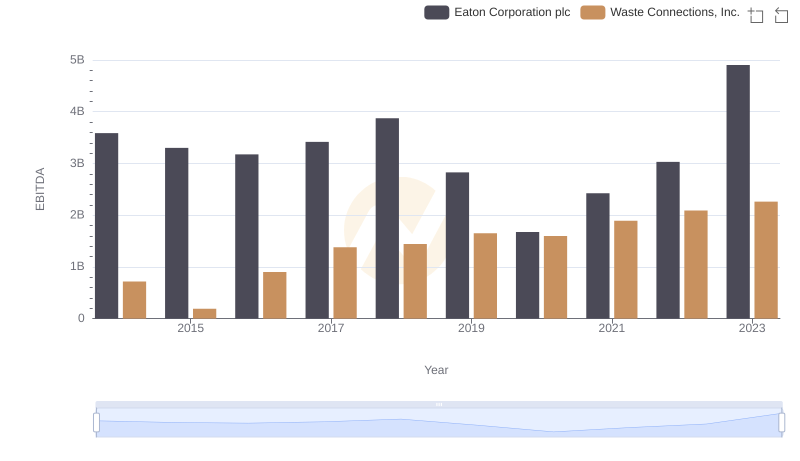
EBITDA Metrics Evaluated: Eaton Corporation plc vs Waste Connections, Inc.