| __timestamp | Eaton Corporation plc | Quanta Services, Inc. |
|---|---|---|
| Wednesday, January 1, 2014 | 3586000000 | 671899000 |
| Thursday, January 1, 2015 | 3302000000 | 497247000 |
| Friday, January 1, 2016 | 3176000000 | 524498000 |
| Sunday, January 1, 2017 | 3418000000 | 647748000 |
| Monday, January 1, 2018 | 3875000000 | 824909000 |
| Tuesday, January 1, 2019 | 2827000000 | 862368000 |
| Wednesday, January 1, 2020 | 1674000000 | 911029000 |
| Friday, January 1, 2021 | 2423000000 | 1052832000 |
| Saturday, January 1, 2022 | 3031000000 | 1483091000 |
| Sunday, January 1, 2023 | 4904000000 | 1770669000 |
| Monday, January 1, 2024 | 5547999771 |
Unlocking the unknown
In the ever-evolving landscape of industrial giants, Eaton Corporation plc and Quanta Services, Inc. have showcased remarkable EBITDA growth over the past decade. From 2014 to 2023, Eaton's EBITDA surged by approximately 37%, peaking at nearly $4.9 billion in 2023. This growth trajectory highlights Eaton's strategic prowess in navigating market challenges and capitalizing on opportunities.
Conversely, Quanta Services, Inc. demonstrated a robust 163% increase in EBITDA, reaching $1.77 billion in 2023. This impressive growth underscores Quanta's agility and innovation in the infrastructure services sector.
While Eaton consistently maintained a higher EBITDA, Quanta's rapid growth rate is noteworthy. The data reveals a compelling narrative of two companies thriving in their respective domains, with Eaton's steady ascent and Quanta's dynamic expansion. As the industrial sector continues to evolve, these trends offer valuable insights into the strategic directions of these industry leaders.
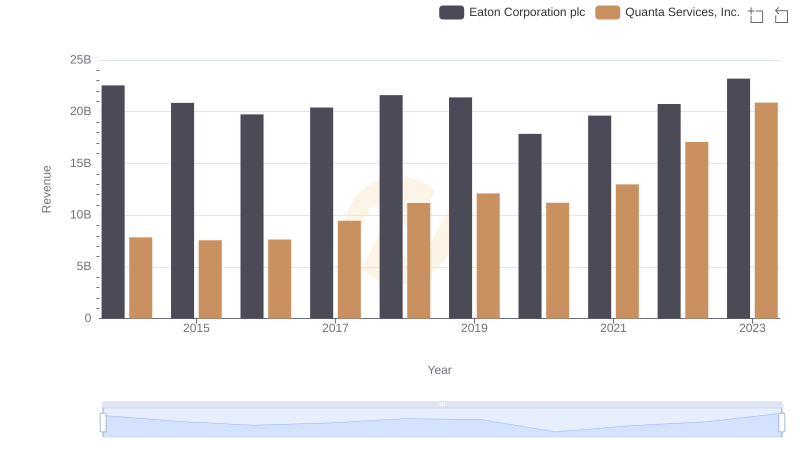
Eaton Corporation plc vs Quanta Services, Inc.: Examining Key Revenue Metrics
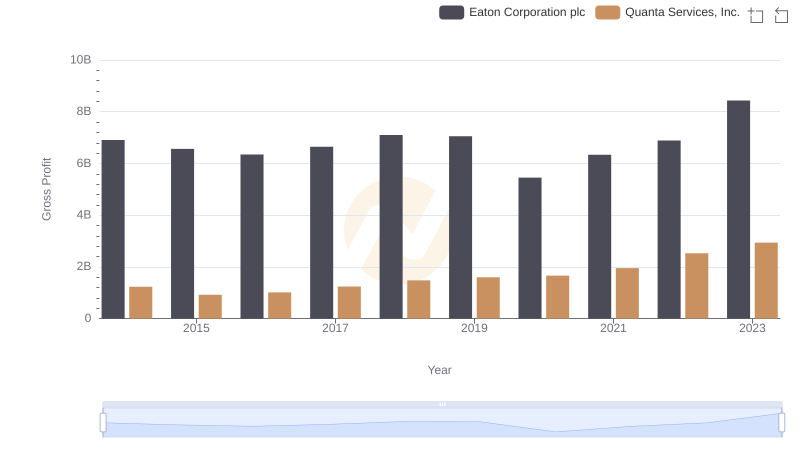
Who Generates Higher Gross Profit? Eaton Corporation plc or Quanta Services, Inc.
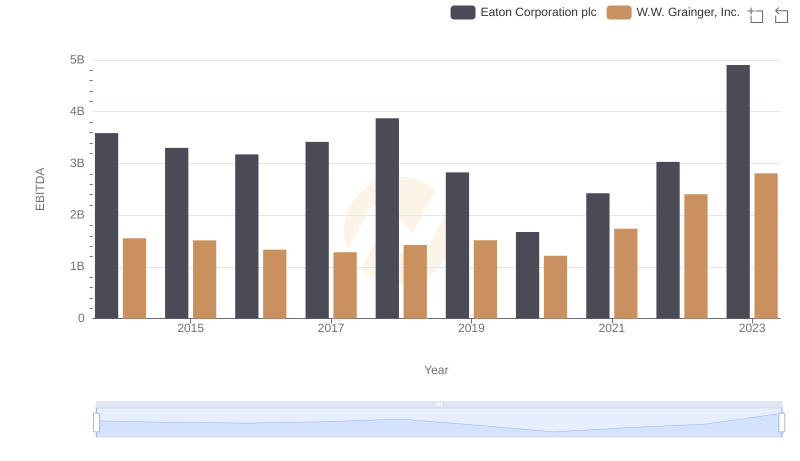
Professional EBITDA Benchmarking: Eaton Corporation plc vs W.W. Grainger, Inc.
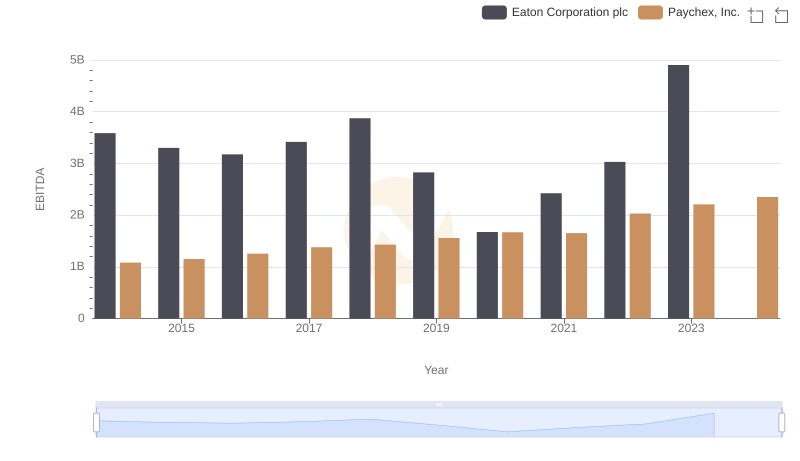
Comprehensive EBITDA Comparison: Eaton Corporation plc vs Paychex, Inc.
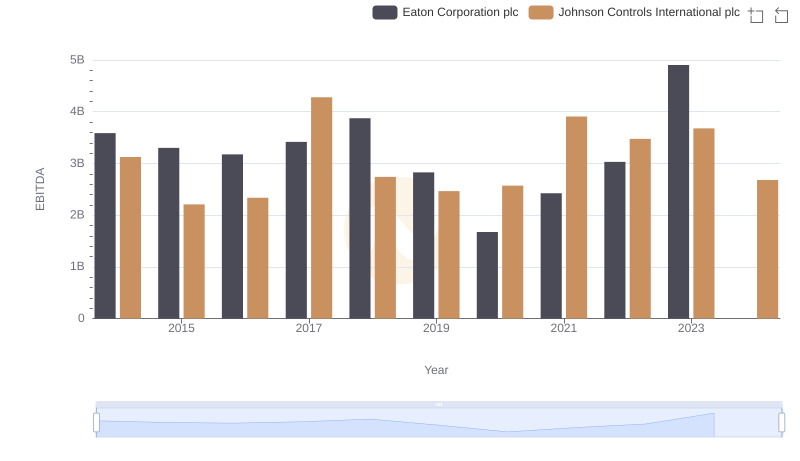
Professional EBITDA Benchmarking: Eaton Corporation plc vs Johnson Controls International plc
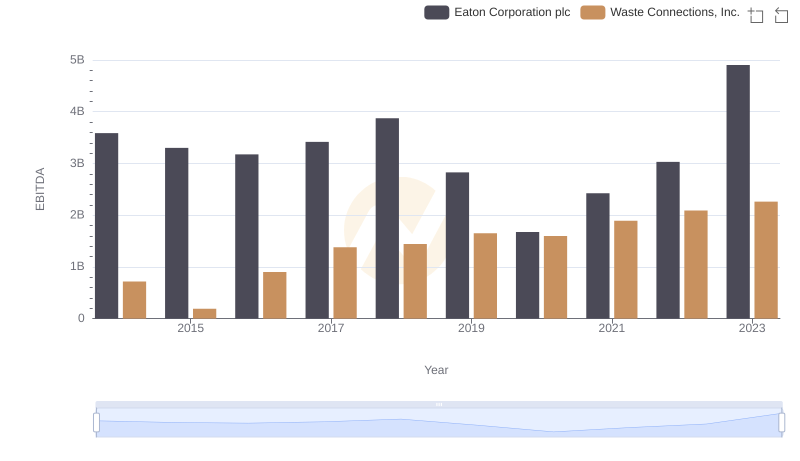
EBITDA Metrics Evaluated: Eaton Corporation plc vs Waste Connections, Inc.
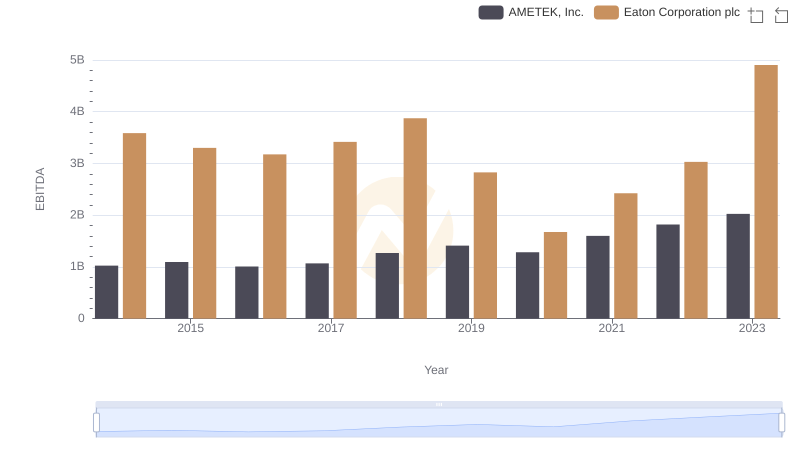
A Professional Review of EBITDA: Eaton Corporation plc Compared to AMETEK, Inc.