| __timestamp | Eaton Corporation plc | Waste Connections, Inc. |
|---|---|---|
| Wednesday, January 1, 2014 | 6906000000 | 940778000 |
| Thursday, January 1, 2015 | 6563000000 | 939878000 |
| Friday, January 1, 2016 | 6347000000 | 1418151000 |
| Sunday, January 1, 2017 | 6648000000 | 1925713000 |
| Monday, January 1, 2018 | 7098000000 | 2057237000 |
| Tuesday, January 1, 2019 | 7052000000 | 2189922000 |
| Wednesday, January 1, 2020 | 5450000000 | 2169182000 |
| Friday, January 1, 2021 | 6335000000 | 2497287000 |
| Saturday, January 1, 2022 | 6887000000 | 2875847000 |
| Sunday, January 1, 2023 | 8433000000 | 3277438000 |
| Monday, January 1, 2024 | 9503000000 | 3727885000 |
Unleashing the power of data
In the ever-evolving landscape of industrial and waste management sectors, understanding financial performance is crucial. This analysis delves into the gross profit trends of Eaton Corporation plc and Waste Connections, Inc. from 2014 to 2023. Over this decade, Eaton Corporation plc demonstrated a robust growth trajectory, with its gross profit peaking at approximately 8.4 billion in 2023, marking a 22% increase from 2014. In contrast, Waste Connections, Inc. showcased a remarkable growth rate, with its gross profit surging by nearly 248% over the same period, reaching around 3.3 billion in 2023. Notably, both companies experienced a dip in 2020, likely due to global economic disruptions. This comparative analysis highlights the resilience and strategic prowess of these industry leaders, offering valuable insights for investors and stakeholders.
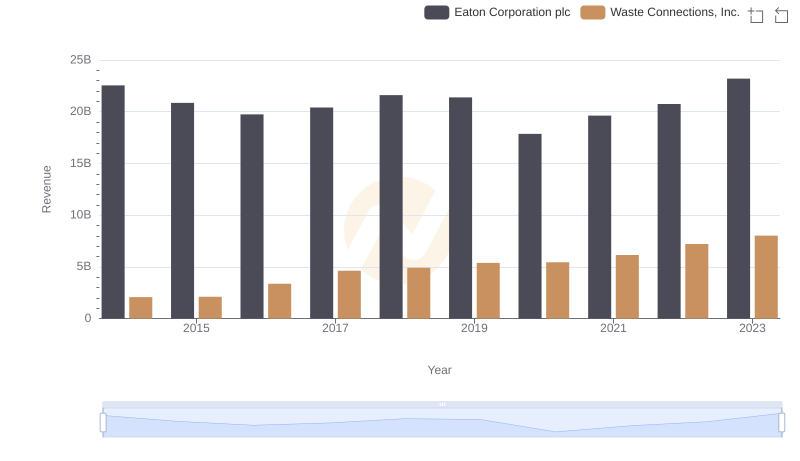
Who Generates More Revenue? Eaton Corporation plc or Waste Connections, Inc.
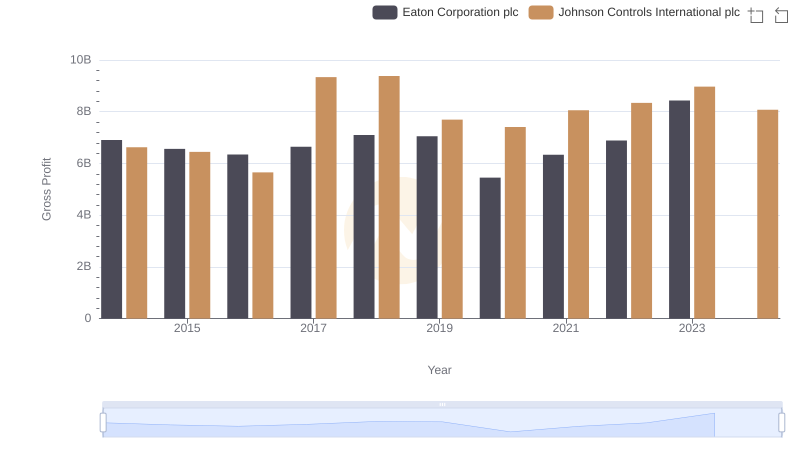
Gross Profit Trends Compared: Eaton Corporation plc vs Johnson Controls International plc
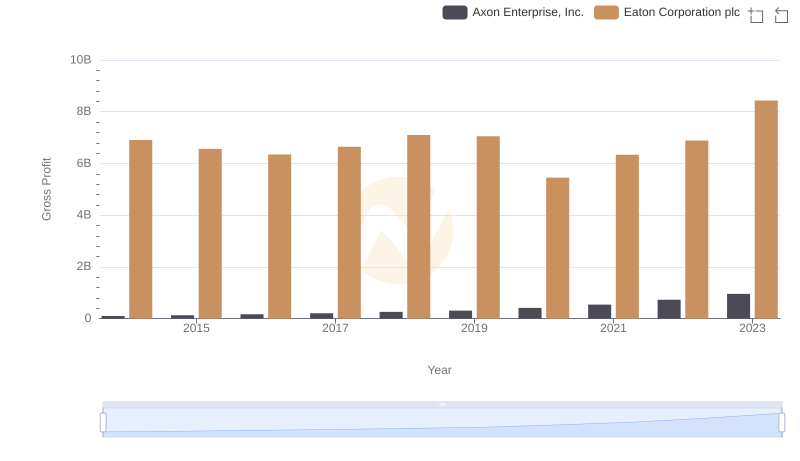
Gross Profit Analysis: Comparing Eaton Corporation plc and Axon Enterprise, Inc.
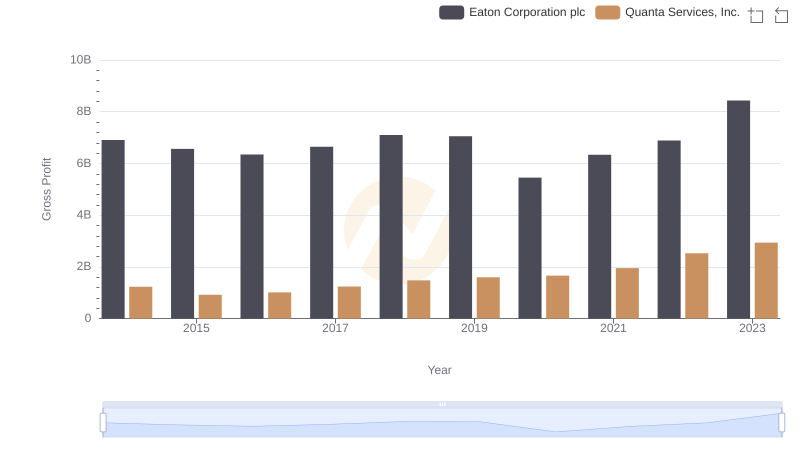
Who Generates Higher Gross Profit? Eaton Corporation plc or Quanta Services, Inc.
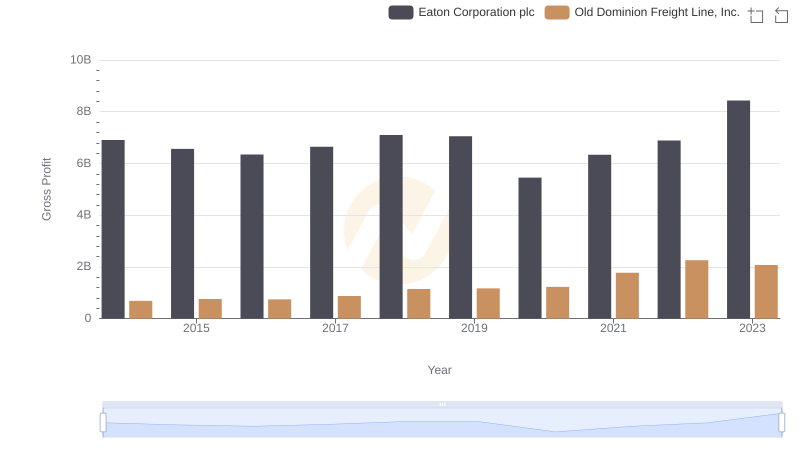
Gross Profit Analysis: Comparing Eaton Corporation plc and Old Dominion Freight Line, Inc.
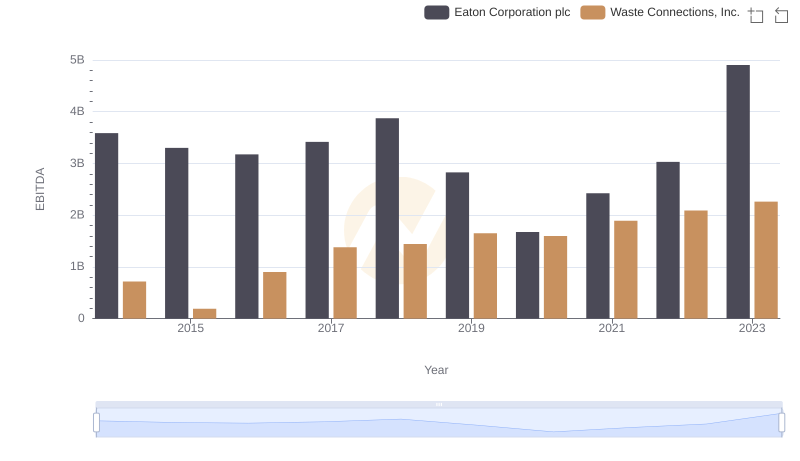
EBITDA Metrics Evaluated: Eaton Corporation plc vs Waste Connections, Inc.