| __timestamp | Caterpillar Inc. | Parker-Hannifin Corporation |
|---|---|---|
| Wednesday, January 1, 2014 | 6929000000 | 1832903000 |
| Thursday, January 1, 2015 | 7705000000 | 1861551000 |
| Friday, January 1, 2016 | 3671000000 | 1558088000 |
| Sunday, January 1, 2017 | 7482000000 | 1846306000 |
| Monday, January 1, 2018 | 11102000000 | 2382235000 |
| Tuesday, January 1, 2019 | 10690000000 | 2513468000 |
| Wednesday, January 1, 2020 | 7267000000 | 2431500000 |
| Friday, January 1, 2021 | 10627000000 | 3092383000 |
| Saturday, January 1, 2022 | 11974000000 | 2441242000 |
| Sunday, January 1, 2023 | 15705000000 | 4071687000 |
| Monday, January 1, 2024 | 16038000000 | 5028229000 |
Cracking the code
In the ever-evolving landscape of industrial giants, Caterpillar Inc. and Parker-Hannifin Corporation stand as titans of their respective domains. Over the past decade, from 2014 to 2023, these companies have showcased their financial prowess through EBITDA metrics, a key indicator of operational efficiency.
Caterpillar Inc. has demonstrated a robust growth trajectory, with its EBITDA surging by approximately 127% from 2014 to 2023. Notably, 2023 marked a peak, with EBITDA reaching an impressive $15.7 billion. In contrast, Parker-Hannifin Corporation, while smaller in scale, has shown consistent growth, with a notable 175% increase in EBITDA over the same period, culminating in $4.07 billion in 2023.
This analysis highlights the resilience and strategic acumen of these industrial leaders, offering valuable insights into their financial health and market strategies.

Breaking Down Revenue Trends: Caterpillar Inc. vs Parker-Hannifin Corporation
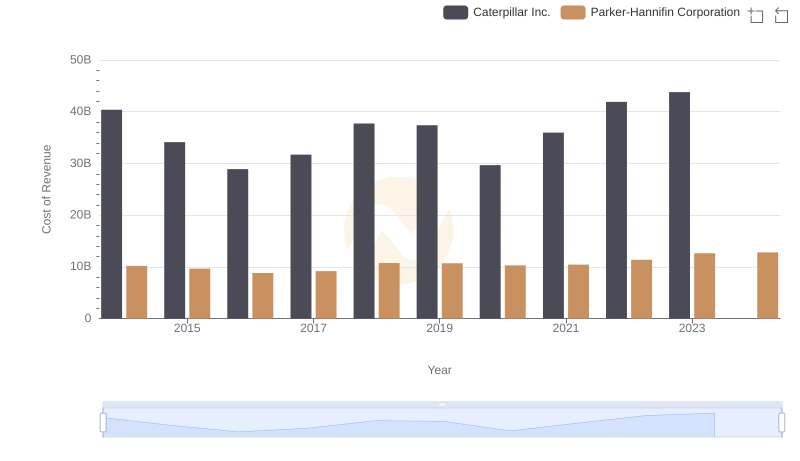
Cost of Revenue Comparison: Caterpillar Inc. vs Parker-Hannifin Corporation

Comparative EBITDA Analysis: Caterpillar Inc. vs Trane Technologies plc
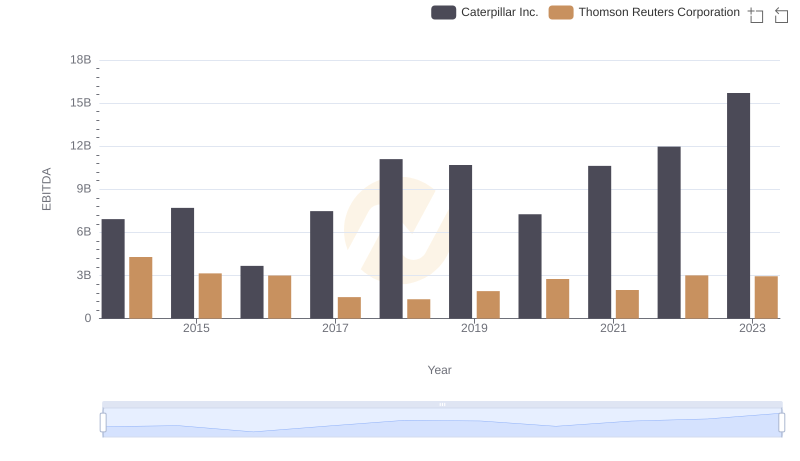
Comparative EBITDA Analysis: Caterpillar Inc. vs Thomson Reuters Corporation
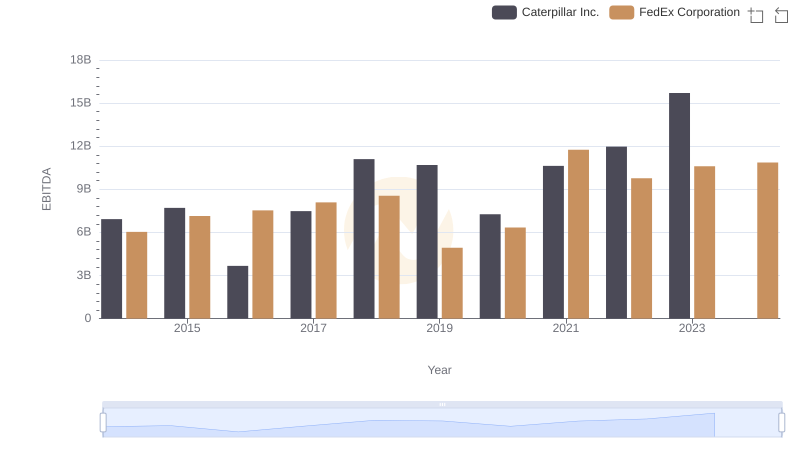
Comprehensive EBITDA Comparison: Caterpillar Inc. vs FedEx Corporation

A Professional Review of EBITDA: Caterpillar Inc. Compared to Canadian National Railway Company