| __timestamp | Caterpillar Inc. | Parker-Hannifin Corporation |
|---|---|---|
| Wednesday, January 1, 2014 | 40391000000 | 10188227000 |
| Thursday, January 1, 2015 | 34133000000 | 9655245000 |
| Friday, January 1, 2016 | 28905000000 | 8823384000 |
| Sunday, January 1, 2017 | 31695000000 | 9188962000 |
| Monday, January 1, 2018 | 37719000000 | 10762841000 |
| Tuesday, January 1, 2019 | 37384000000 | 10703484000 |
| Wednesday, January 1, 2020 | 29671000000 | 10286518000 |
| Friday, January 1, 2021 | 35968000000 | 10449680000 |
| Saturday, January 1, 2022 | 41915000000 | 11387267000 |
| Sunday, January 1, 2023 | 43797000000 | 12635892000 |
| Monday, January 1, 2024 | 41485000000 | 12801816000 |
Unlocking the unknown
In the industrial sector, Caterpillar Inc. and Parker-Hannifin Corporation have long been titans, each with a storied history of innovation and growth. From 2014 to 2023, Caterpillar's cost of revenue fluctuated, peaking in 2023 with a 51% increase from its 2016 low. Meanwhile, Parker-Hannifin's cost of revenue steadily climbed, reaching a 43% rise over the same period. This trend highlights the resilience and adaptability of these companies in a competitive market. Notably, 2024 data for Caterpillar is missing, leaving room for speculation on its future trajectory. As these industry leaders continue to evolve, their financial strategies offer valuable insights into managing costs and driving profitability in the face of global challenges.

Breaking Down Revenue Trends: Caterpillar Inc. vs Parker-Hannifin Corporation

Caterpillar Inc. vs United Parcel Service, Inc.: Efficiency in Cost of Revenue Explored

Caterpillar Inc. vs Automatic Data Processing, Inc.: Efficiency in Cost of Revenue Explored
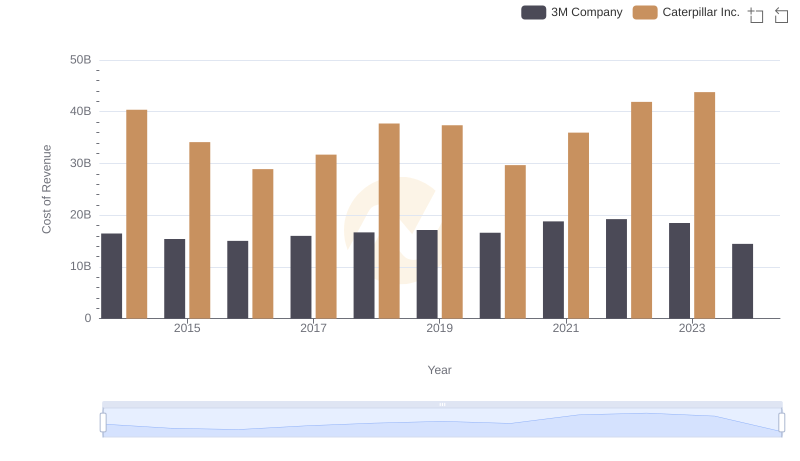
Cost of Revenue Comparison: Caterpillar Inc. vs 3M Company

EBITDA Metrics Evaluated: Caterpillar Inc. vs Parker-Hannifin Corporation