| __timestamp | Caterpillar Inc. | Parker-Hannifin Corporation |
|---|---|---|
| Wednesday, January 1, 2014 | 55184000000 | 13215971000 |
| Thursday, January 1, 2015 | 47011000000 | 12711744000 |
| Friday, January 1, 2016 | 38537000000 | 11360753000 |
| Sunday, January 1, 2017 | 45462000000 | 12029312000 |
| Monday, January 1, 2018 | 54722000000 | 14302392000 |
| Tuesday, January 1, 2019 | 53800000000 | 14320324000 |
| Wednesday, January 1, 2020 | 41748000000 | 13695520000 |
| Friday, January 1, 2021 | 50971000000 | 14347640000 |
| Saturday, January 1, 2022 | 59427000000 | 15861608000 |
| Sunday, January 1, 2023 | 67060000000 | 19065194000 |
| Monday, January 1, 2024 | 64809000000 | 19929606000 |
Unlocking the unknown
In the competitive landscape of industrial manufacturing, Caterpillar Inc. and Parker-Hannifin Corporation have long been titans. Over the past decade, Caterpillar's revenue has seen a rollercoaster ride, peaking in 2023 with a remarkable 74% increase from its 2016 low. Meanwhile, Parker-Hannifin has steadily climbed, achieving a 75% growth from 2014 to 2023.
Caterpillar's revenue dipped significantly in 2016, only to rebound strongly in subsequent years, reflecting its resilience and strategic market positioning. Parker-Hannifin, on the other hand, has shown consistent growth, with a notable surge in 2023, marking its highest revenue in the decade.
While Parker-Hannifin's 2024 data is available, Caterpillar's is not, leaving room for speculation on its future trajectory. This analysis underscores the dynamic nature of the industrial sector and the strategic maneuvers of these industry leaders.
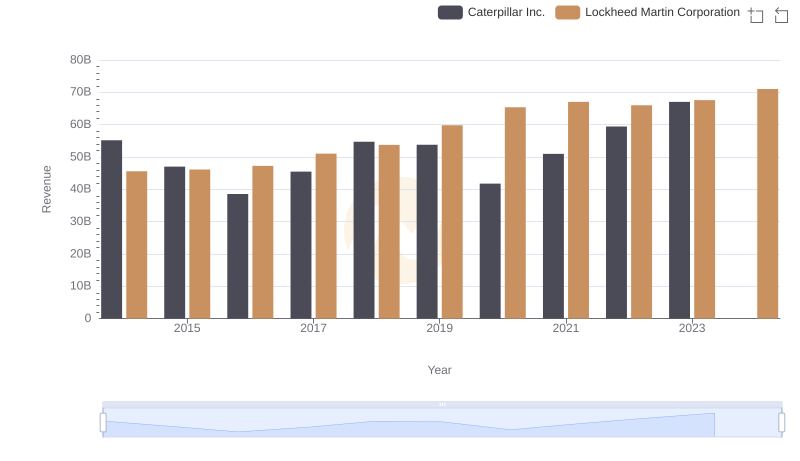
Caterpillar Inc. vs Lockheed Martin Corporation: Examining Key Revenue Metrics
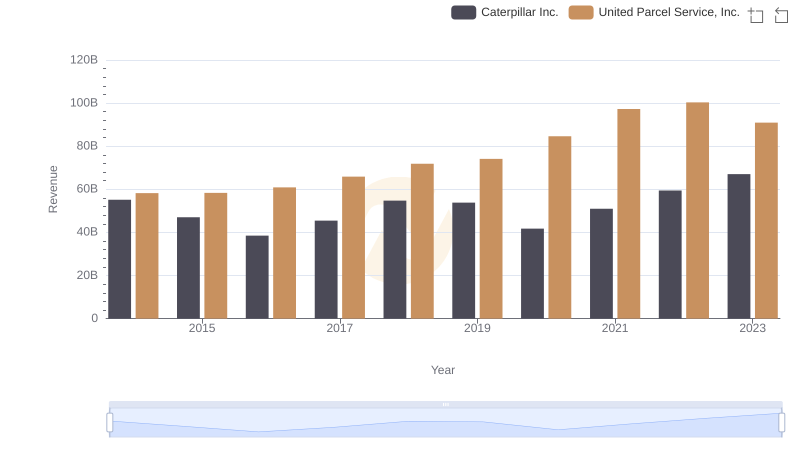
Who Generates More Revenue? Caterpillar Inc. or United Parcel Service, Inc.
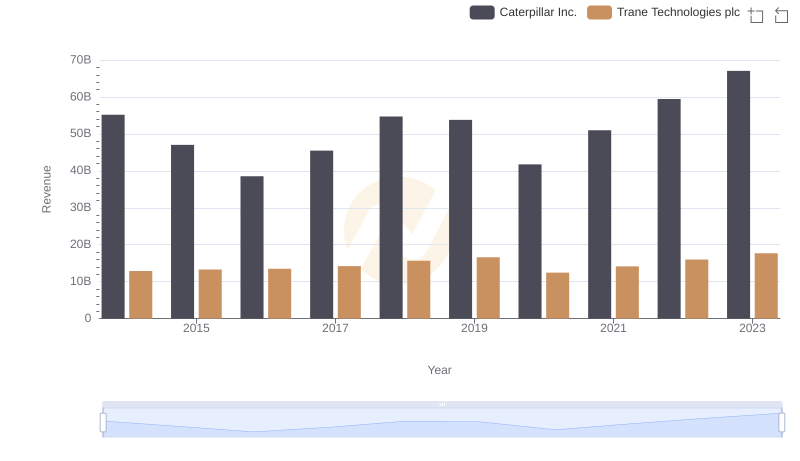
Who Generates More Revenue? Caterpillar Inc. or Trane Technologies plc

Caterpillar Inc. vs 3M Company: Examining Key Revenue Metrics
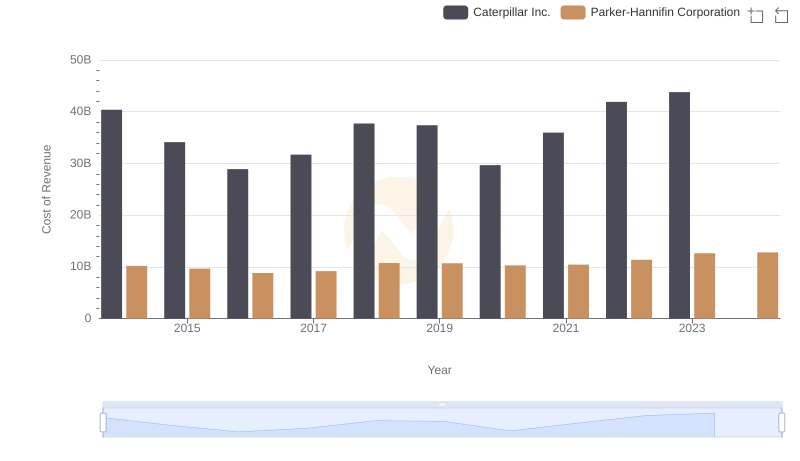
Cost of Revenue Comparison: Caterpillar Inc. vs Parker-Hannifin Corporation

EBITDA Metrics Evaluated: Caterpillar Inc. vs Parker-Hannifin Corporation