| __timestamp | Caterpillar Inc. | Trane Technologies plc |
|---|---|---|
| Wednesday, January 1, 2014 | 6929000000 | 1757000000 |
| Thursday, January 1, 2015 | 7705000000 | 1835000000 |
| Friday, January 1, 2016 | 3671000000 | 2311000000 |
| Sunday, January 1, 2017 | 7482000000 | 1982500000 |
| Monday, January 1, 2018 | 11102000000 | 2242400000 |
| Tuesday, January 1, 2019 | 10690000000 | 1931200000 |
| Wednesday, January 1, 2020 | 7267000000 | 1831900000 |
| Friday, January 1, 2021 | 10627000000 | 2319200000 |
| Saturday, January 1, 2022 | 11974000000 | 2715500000 |
| Sunday, January 1, 2023 | 15705000000 | 3149900000 |
| Monday, January 1, 2024 | 16038000000 | 3859600000 |
Unlocking the unknown
In the ever-evolving landscape of industrial giants, Caterpillar Inc. and Trane Technologies plc have showcased remarkable financial trajectories over the past decade. From 2014 to 2023, Caterpillar's EBITDA surged by approximately 127%, peaking in 2023. This growth underscores its resilience and adaptability in a competitive market. Meanwhile, Trane Technologies, though smaller in scale, demonstrated a steady increase of around 79% in the same period, reflecting its strategic focus on sustainable solutions.
This comparative analysis not only highlights the financial prowess of these industry leaders but also offers a glimpse into their strategic directions for the future.
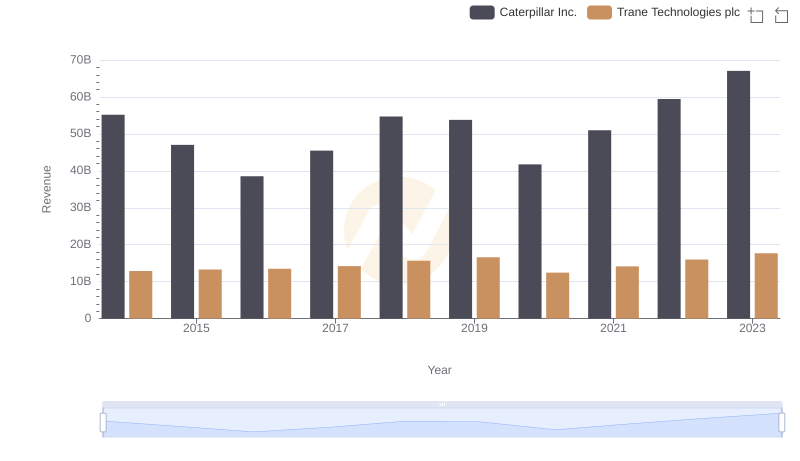
Who Generates More Revenue? Caterpillar Inc. or Trane Technologies plc

R&D Spending Showdown: Caterpillar Inc. vs Trane Technologies plc
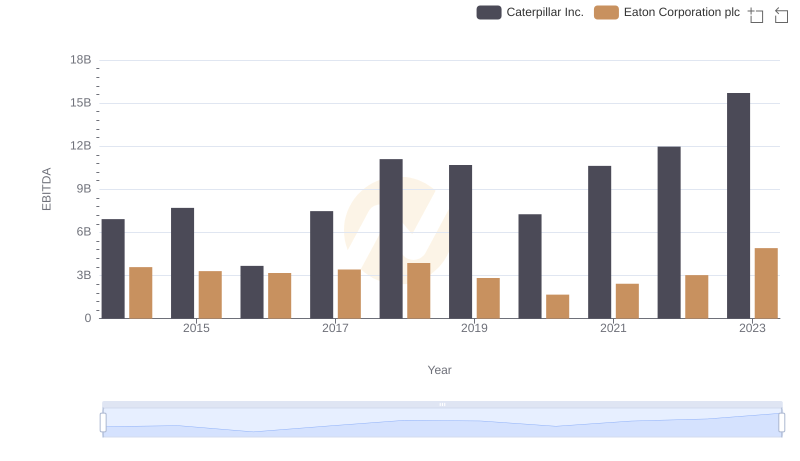
Caterpillar Inc. and Eaton Corporation plc: A Detailed Examination of EBITDA Performance

EBITDA Metrics Evaluated: Caterpillar Inc. vs Parker-Hannifin Corporation
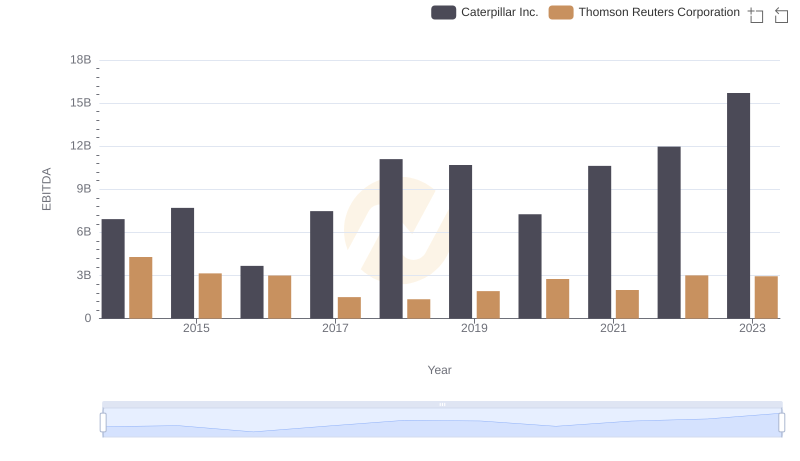
Comparative EBITDA Analysis: Caterpillar Inc. vs Thomson Reuters Corporation
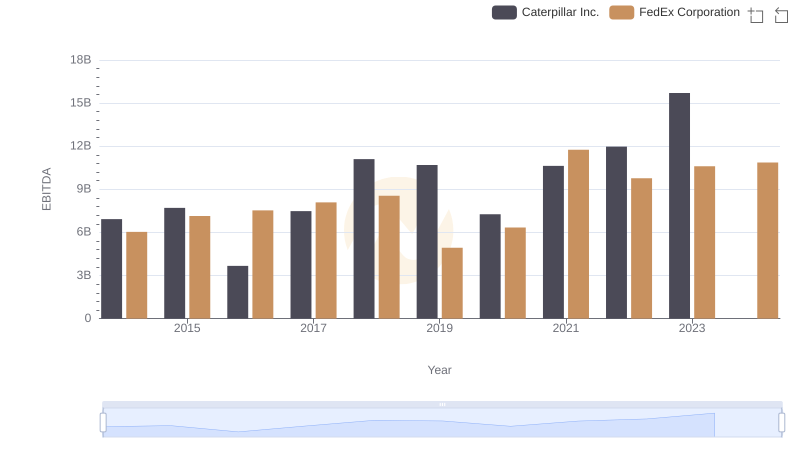
Comprehensive EBITDA Comparison: Caterpillar Inc. vs FedEx Corporation