| __timestamp | Canadian National Railway Company | Caterpillar Inc. |
|---|---|---|
| Wednesday, January 1, 2014 | 5674000000 | 6929000000 |
| Thursday, January 1, 2015 | 6424000000 | 7705000000 |
| Friday, January 1, 2016 | 6537000000 | 3671000000 |
| Sunday, January 1, 2017 | 6839000000 | 7482000000 |
| Monday, January 1, 2018 | 7124000000 | 11102000000 |
| Tuesday, January 1, 2019 | 7999000000 | 10690000000 |
| Wednesday, January 1, 2020 | 7652000000 | 7267000000 |
| Friday, January 1, 2021 | 7607000000 | 10627000000 |
| Saturday, January 1, 2022 | 9067000000 | 11974000000 |
| Sunday, January 1, 2023 | 9027000000 | 15705000000 |
| Monday, January 1, 2024 | 16038000000 |
Unleashing the power of data
In the world of industrial giants, EBITDA serves as a crucial indicator of financial health. Over the past decade, Caterpillar Inc. and Canadian National Railway Company have showcased intriguing trends. From 2014 to 2023, Caterpillar's EBITDA surged by approximately 127%, peaking in 2023. This growth reflects Caterpillar's resilience and adaptability in a fluctuating global market. Meanwhile, Canadian National Railway experienced a steady 59% increase, highlighting its consistent performance in the North American rail industry.
These trends underscore the dynamic nature of these industries, offering valuable insights for investors and industry enthusiasts alike.

Comparative EBITDA Analysis: Caterpillar Inc. vs Trane Technologies plc

EBITDA Metrics Evaluated: Caterpillar Inc. vs Parker-Hannifin Corporation
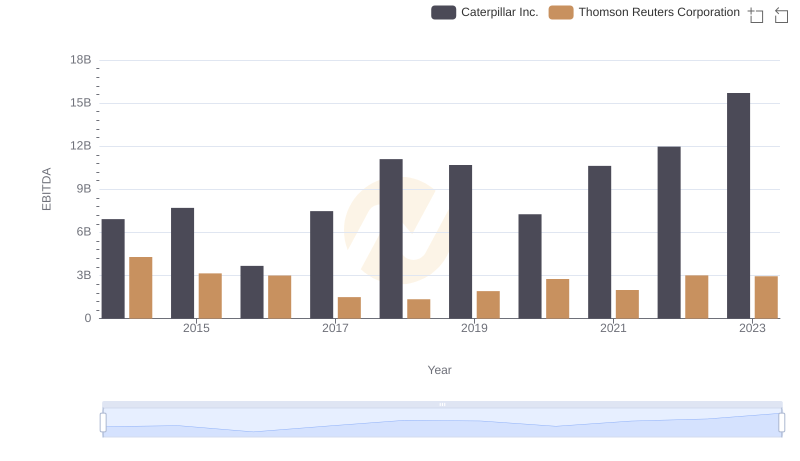
Comparative EBITDA Analysis: Caterpillar Inc. vs Thomson Reuters Corporation
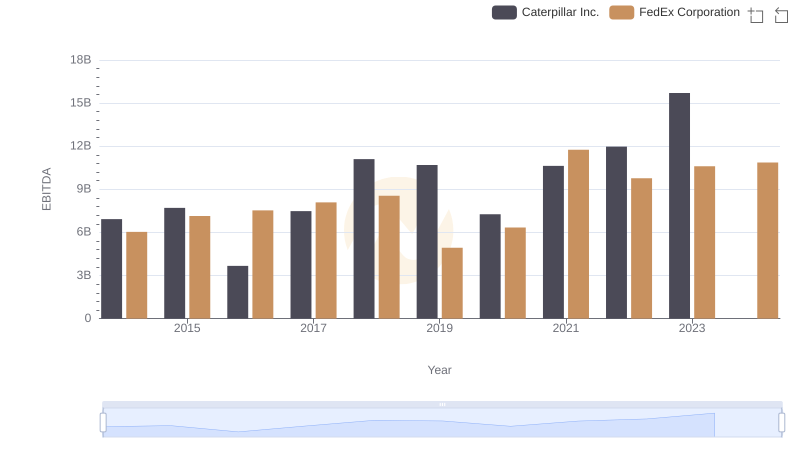
Comprehensive EBITDA Comparison: Caterpillar Inc. vs FedEx Corporation

Comprehensive EBITDA Comparison: Caterpillar Inc. vs Republic Services, Inc.
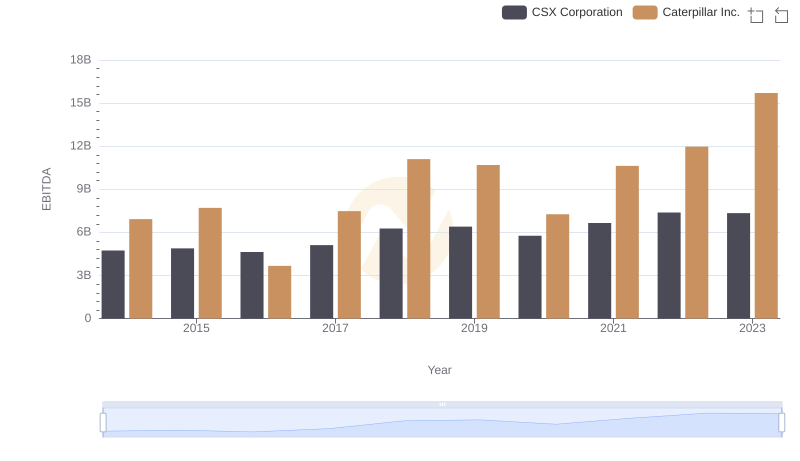
Professional EBITDA Benchmarking: Caterpillar Inc. vs CSX Corporation