| __timestamp | Automatic Data Processing, Inc. | EMCOR Group, Inc. |
|---|---|---|
| Wednesday, January 1, 2014 | 2616900000 | 355858000 |
| Thursday, January 1, 2015 | 2355100000 | 362095000 |
| Friday, January 1, 2016 | 2579500000 | 395913000 |
| Sunday, January 1, 2017 | 2927200000 | 478459000 |
| Monday, January 1, 2018 | 2762900000 | 489954000 |
| Tuesday, January 1, 2019 | 3544500000 | 556055000 |
| Wednesday, January 1, 2020 | 3769700000 | 601449000 |
| Friday, January 1, 2021 | 3931600000 | 646861000 |
| Saturday, January 1, 2022 | 4405500000 | 682399000 |
| Sunday, January 1, 2023 | 5244600000 | 1009017000 |
| Monday, January 1, 2024 | 5800000000 |
Data in motion
In the ever-evolving landscape of corporate finance, EBITDA serves as a crucial metric for evaluating a company's operational performance. Over the past decade, Automatic Data Processing, Inc. (ADP) and EMCOR Group, Inc. have demonstrated contrasting trajectories in their EBITDA growth. From 2014 to 2023, ADP's EBITDA surged by approximately 122%, reflecting its robust business model and strategic initiatives. In contrast, EMCOR Group, Inc. experienced a more modest growth of around 184%, highlighting its steady expansion in the construction and facilities services sector.
The data reveals a significant leap for ADP in 2023, with a 19% increase from the previous year, while EMCOR's EBITDA reached its peak in the same year. Notably, the data for 2024 is incomplete, leaving room for speculation on future trends. This analysis underscores the dynamic nature of these industries and the importance of strategic financial management.
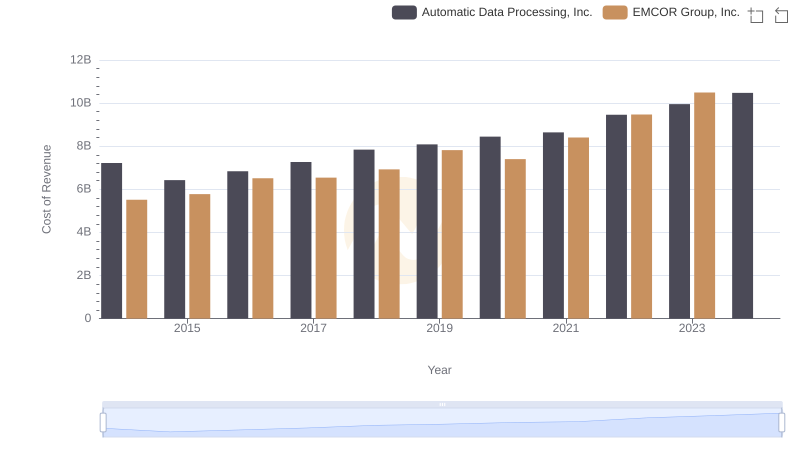
Comparing Cost of Revenue Efficiency: Automatic Data Processing, Inc. vs EMCOR Group, Inc.
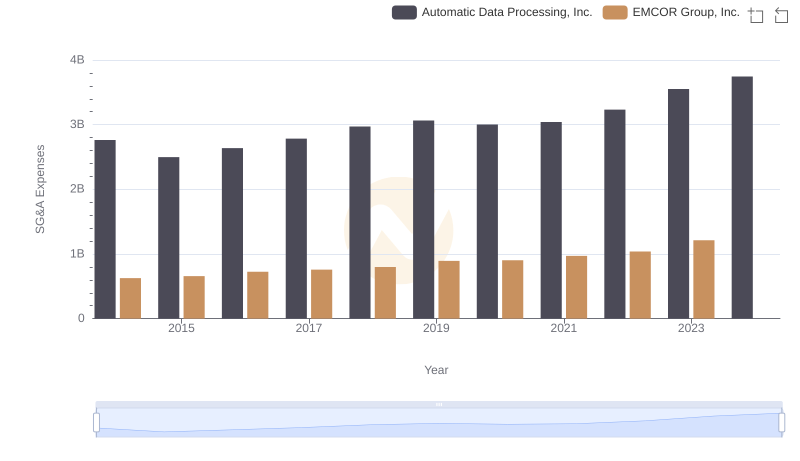
Breaking Down SG&A Expenses: Automatic Data Processing, Inc. vs EMCOR Group, Inc.
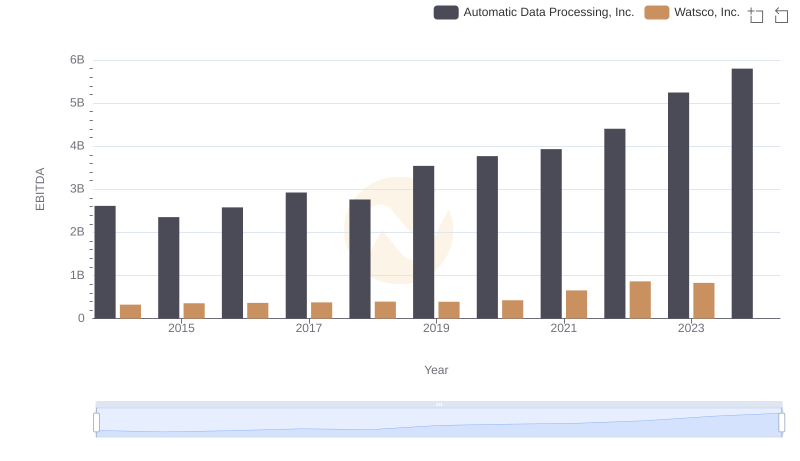
EBITDA Metrics Evaluated: Automatic Data Processing, Inc. vs Watsco, Inc.
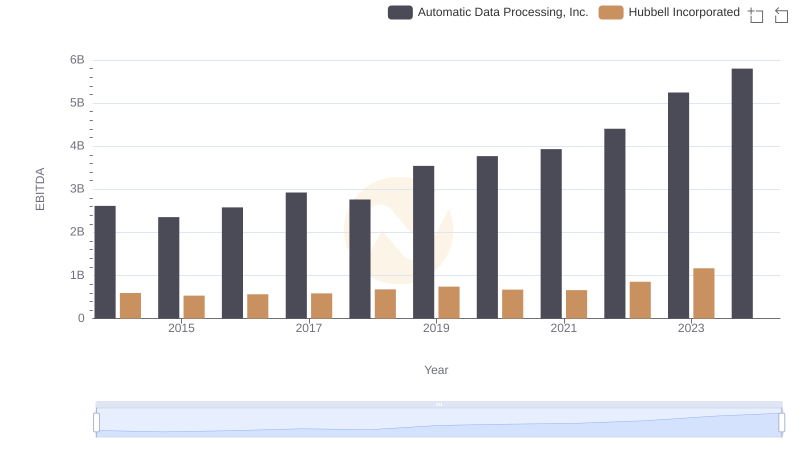
EBITDA Performance Review: Automatic Data Processing, Inc. vs Hubbell Incorporated
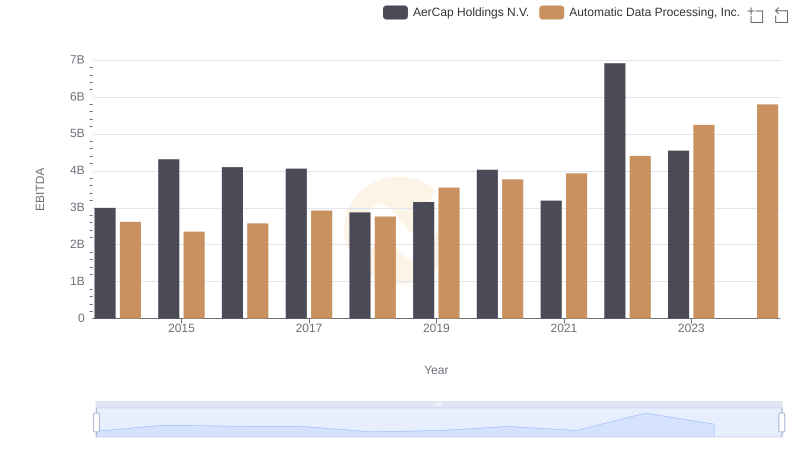
Professional EBITDA Benchmarking: Automatic Data Processing, Inc. vs AerCap Holdings N.V.
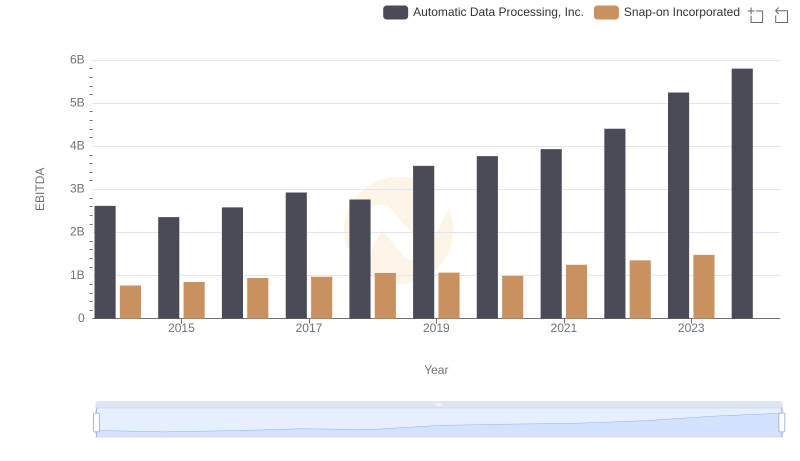
Professional EBITDA Benchmarking: Automatic Data Processing, Inc. vs Snap-on Incorporated
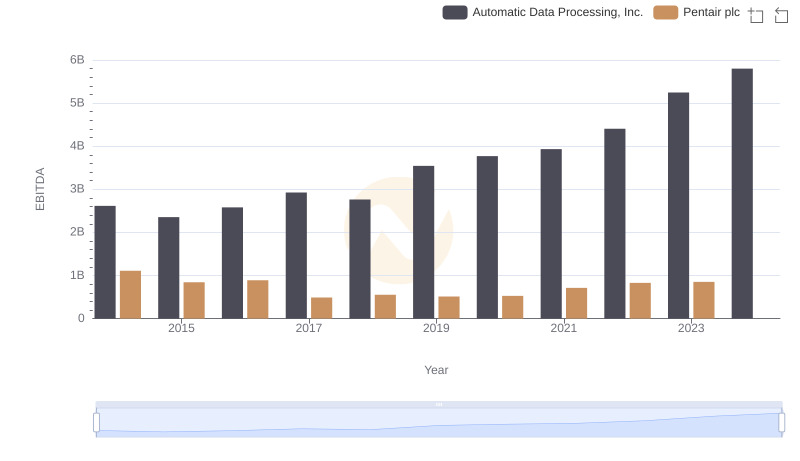
Comprehensive EBITDA Comparison: Automatic Data Processing, Inc. vs Pentair plc
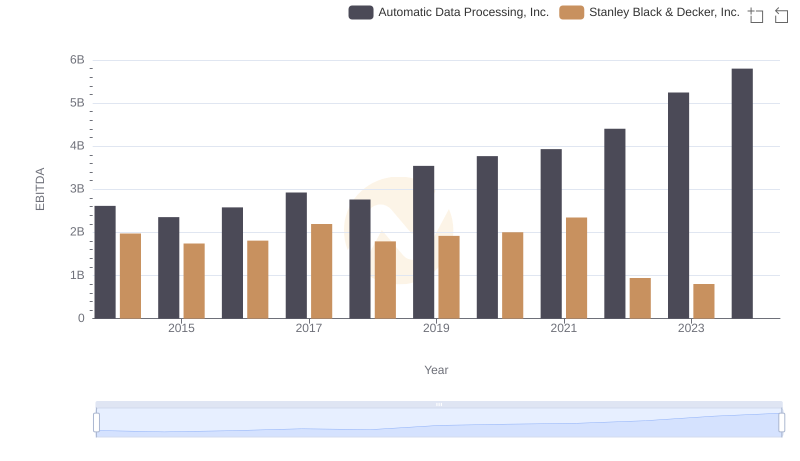
A Side-by-Side Analysis of EBITDA: Automatic Data Processing, Inc. and Stanley Black & Decker, Inc.