| __timestamp | Automatic Data Processing, Inc. | EMCOR Group, Inc. |
|---|---|---|
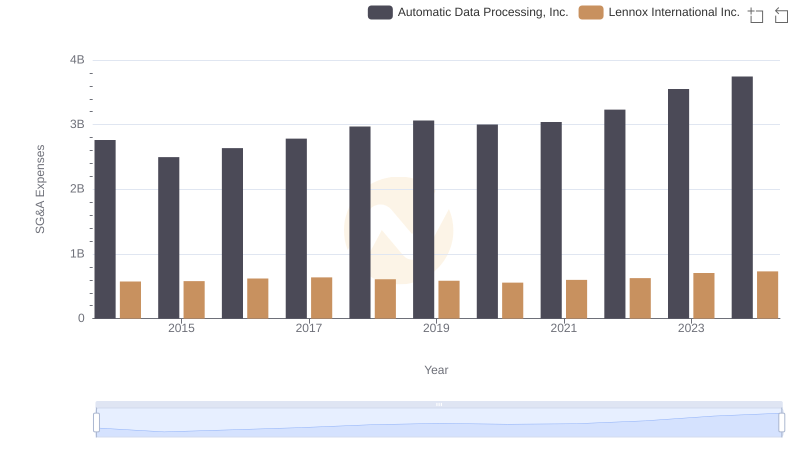
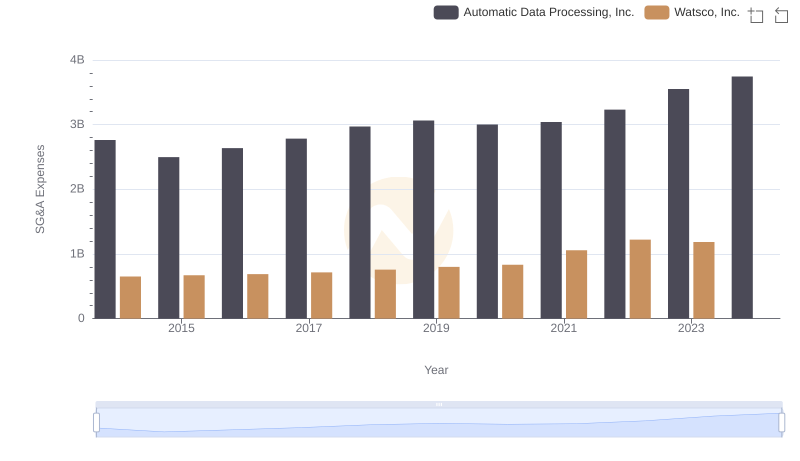
| Wednesday, January 1, 2014 | 2762400000 | 626478000 |
| Thursday, January 1, 2015 | 2496900000 | 656573000 |
| Friday, January 1, 2016 | 2637000000 | 725538000 |
| Sunday, January 1, 2017 | 2783200000 | 757062000 |
| Monday, January 1, 2018 | 2971500000 | 799157000 |
| Tuesday, January 1, 2019 | 3064200000 | 893453000 |
| Wednesday, January 1, 2020 | 3003000000 | 903584000 |
| Friday, January 1, 2021 | 3040500000 | 970937000 |
| Saturday, January 1, 2022 | 3233200000 | 1038717000 |
| Sunday, January 1, 2023 | 3551400000 | 1211233000 |
| Monday, January 1, 2024 | 3778900000 |
Unlocking the unknown
In the ever-evolving landscape of corporate finance, understanding Selling, General, and Administrative (SG&A) expenses is crucial for evaluating a company's operational efficiency. Over the past decade, Automatic Data Processing, Inc. (ADP) and EMCOR Group, Inc. have showcased distinct trajectories in their SG&A expenditures. From 2014 to 2023, ADP's SG&A expenses surged by approximately 36%, peaking at $3.55 billion in 2023. In contrast, EMCOR Group's expenses grew by about 93% during the same period, reaching $1.21 billion. This stark difference highlights ADP's consistent yet moderate growth, while EMCOR's expenses nearly doubled, reflecting its aggressive expansion strategy. Notably, data for 2024 is incomplete, indicating potential shifts in these trends. As businesses navigate post-pandemic recovery, these insights offer a window into strategic financial management, emphasizing the importance of balancing growth with cost efficiency.
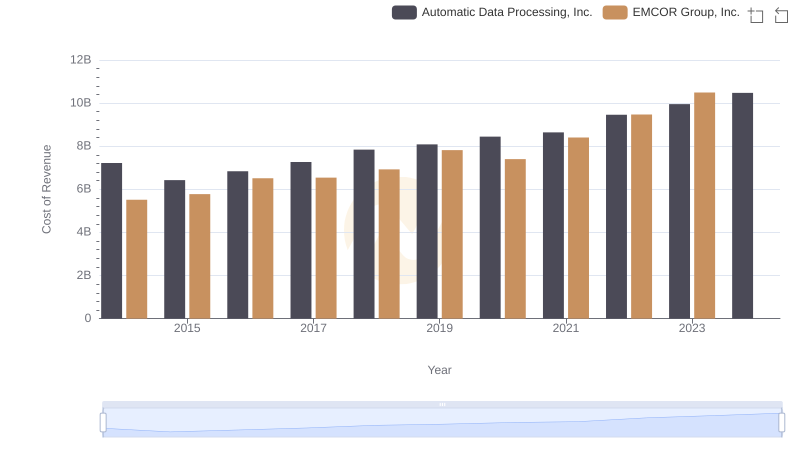
Comparing Cost of Revenue Efficiency: Automatic Data Processing, Inc. vs EMCOR Group, Inc.
Who Optimizes SG&A Costs Better? Automatic Data Processing, Inc. or Lennox International Inc.
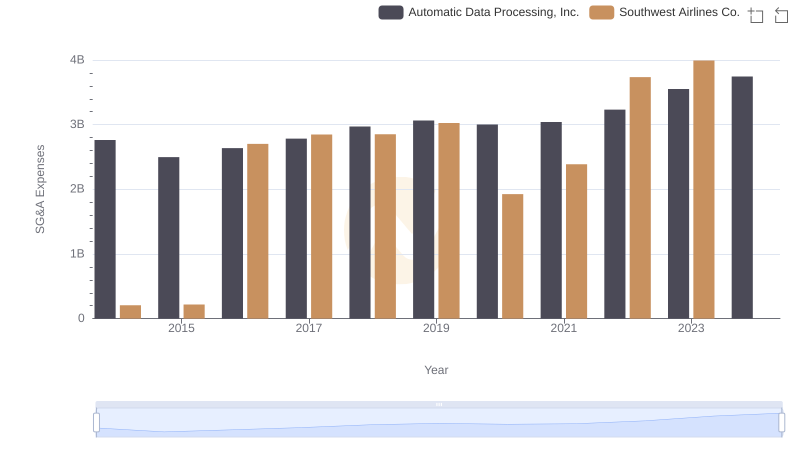
Who Optimizes SG&A Costs Better? Automatic Data Processing, Inc. or Southwest Airlines Co.
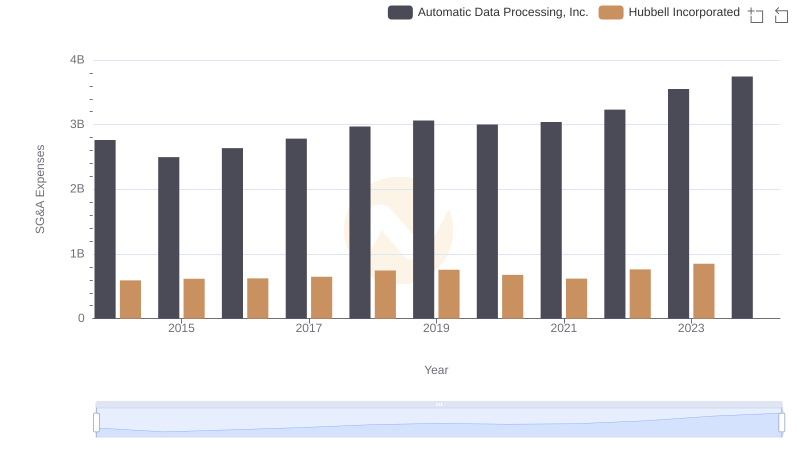
Comparing SG&A Expenses: Automatic Data Processing, Inc. vs Hubbell Incorporated Trends and Insights
EBITDA Metrics Evaluated: Automatic Data Processing, Inc. vs EMCOR Group, Inc.

Breaking Down SG&A Expenses: Automatic Data Processing, Inc. vs AerCap Holdings N.V.
Who Optimizes SG&A Costs Better? Automatic Data Processing, Inc. or Watsco, Inc.

Operational Costs Compared: SG&A Analysis of Automatic Data Processing, Inc. and Snap-on Incorporated