| __timestamp | Adobe Inc. | SS&C Technologies Holdings, Inc. |
|---|---|---|
| Wednesday, January 1, 2014 | 734698000 | 304662000 |
| Thursday, January 1, 2015 | 1277438000 | 291009000 |
| Friday, January 1, 2016 | 1837115000 | 522241000 |
| Sunday, January 1, 2017 | 2538040000 | 628500000 |
| Monday, January 1, 2018 | 3229610000 | 923700000 |
| Tuesday, January 1, 2019 | 4097396000 | 1716500000 |
| Wednesday, January 1, 2020 | 5133000000 | 1751000000 |
| Friday, January 1, 2021 | 6675000000 | 1910100000 |
| Saturday, January 1, 2022 | 7055000000 | 1859800000 |
| Sunday, January 1, 2023 | 6650000000 | 2004400000 |
| Monday, January 1, 2024 | 7957000000 | 1343500000 |
Cracking the code
In the ever-evolving landscape of technology, Adobe Inc. and SS&C Technologies Holdings, Inc. have showcased remarkable EBITDA growth over the past decade. Adobe Inc. has seen its EBITDA surge by over 980% from 2014 to 2024, reflecting its robust business model and strategic innovations. In contrast, SS&C Technologies Holdings, Inc. has experienced a commendable growth of approximately 560% during the same period, underscoring its resilience and adaptability in the financial services sector.
This analysis provides a compelling snapshot of how these tech giants have navigated the financial landscape, offering valuable insights for investors and industry enthusiasts alike.
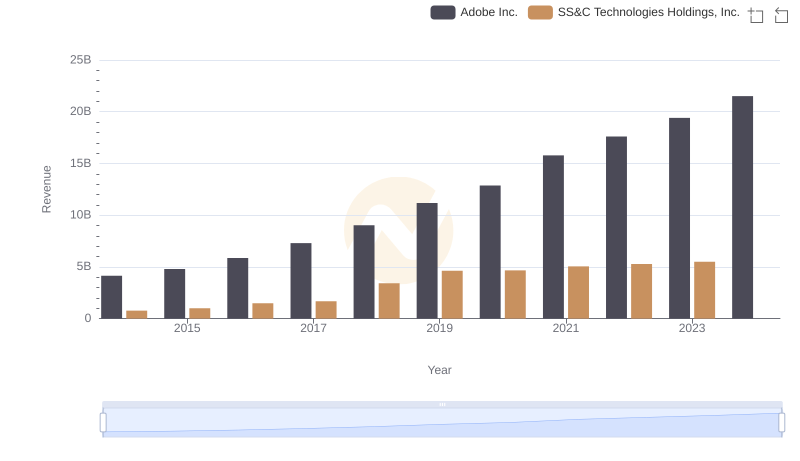
Comparing Revenue Performance: Adobe Inc. or SS&C Technologies Holdings, Inc.?
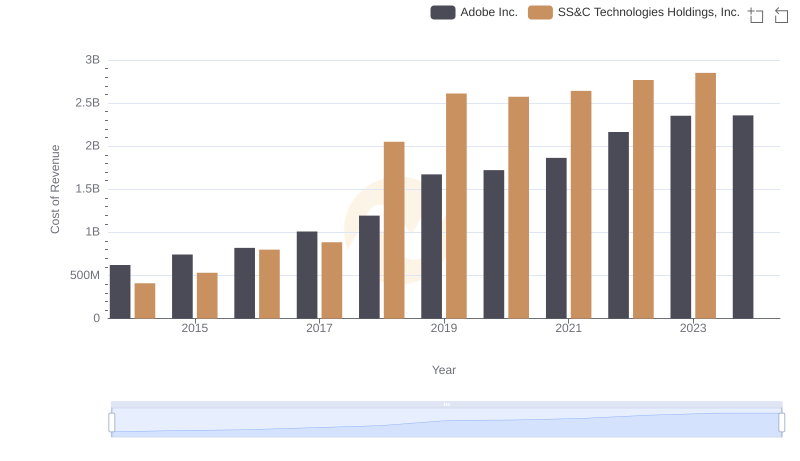
Comparing Cost of Revenue Efficiency: Adobe Inc. vs SS&C Technologies Holdings, Inc.
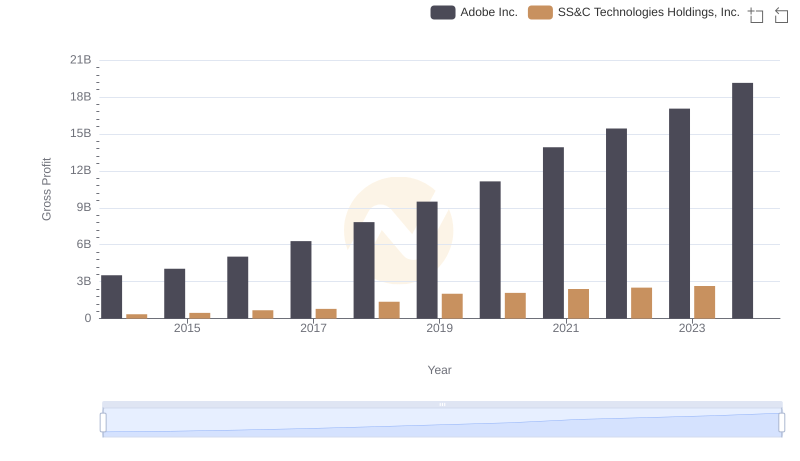
Key Insights on Gross Profit: Adobe Inc. vs SS&C Technologies Holdings, Inc.
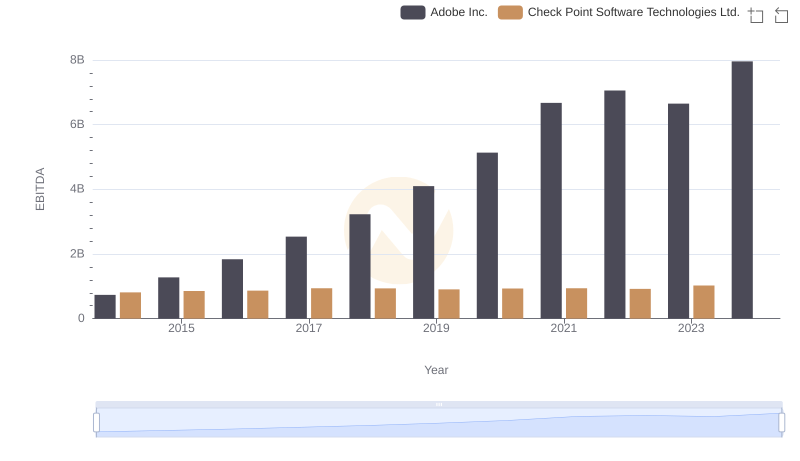
EBITDA Performance Review: Adobe Inc. vs Check Point Software Technologies Ltd.
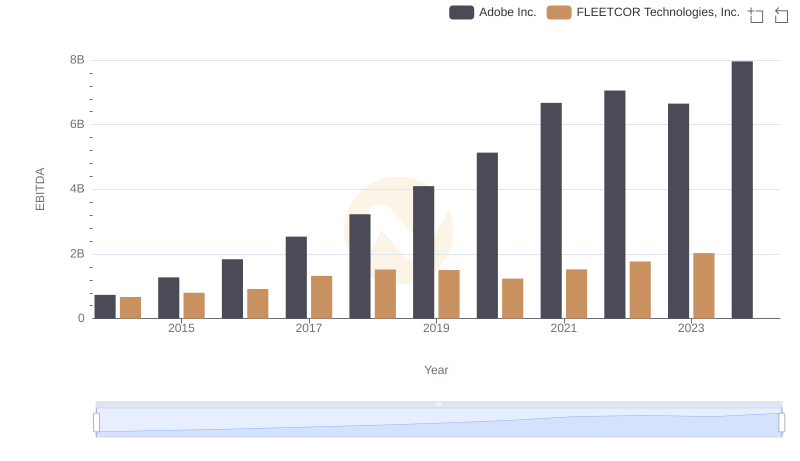
EBITDA Analysis: Evaluating Adobe Inc. Against FLEETCOR Technologies, Inc.
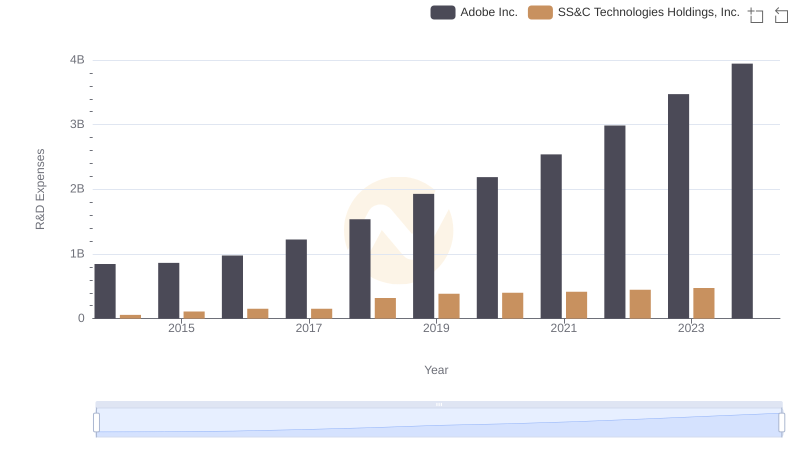
Adobe Inc. or SS&C Technologies Holdings, Inc.: Who Invests More in Innovation?
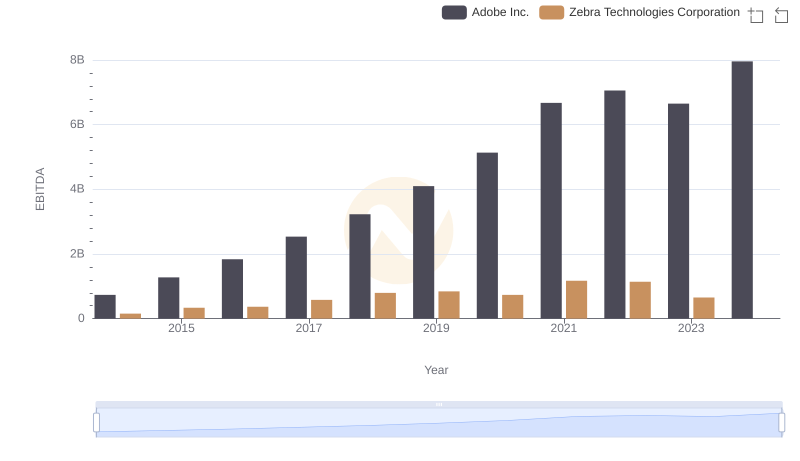
Comparative EBITDA Analysis: Adobe Inc. vs Zebra Technologies Corporation
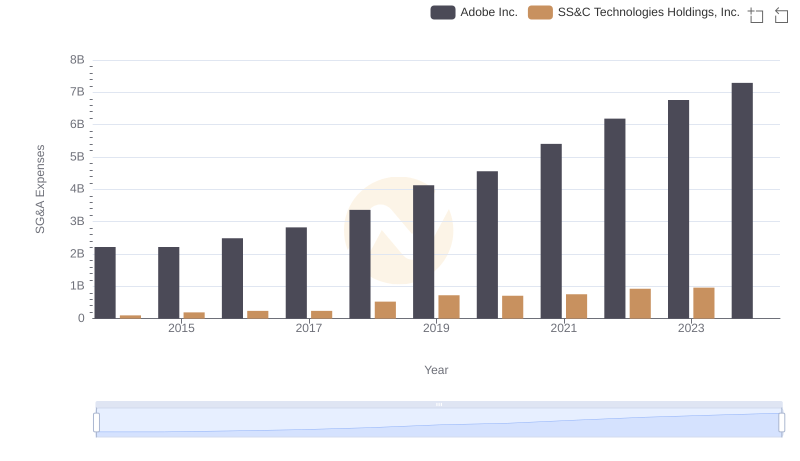
Comparing SG&A Expenses: Adobe Inc. vs SS&C Technologies Holdings, Inc. Trends and Insights
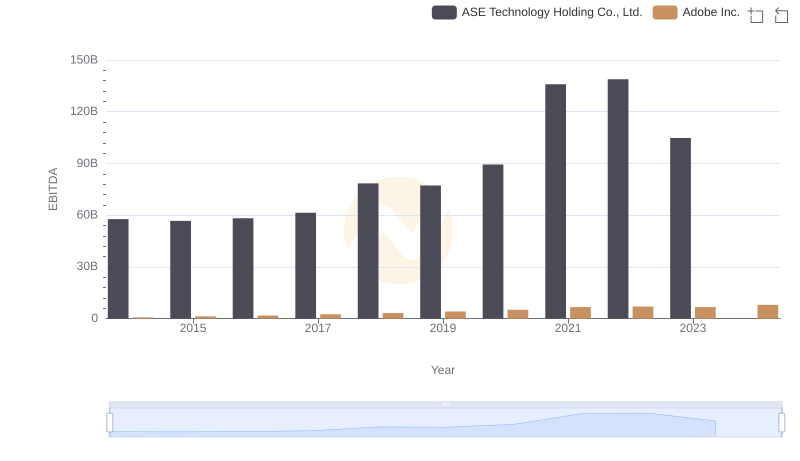
EBITDA Metrics Evaluated: Adobe Inc. vs ASE Technology Holding Co., Ltd.
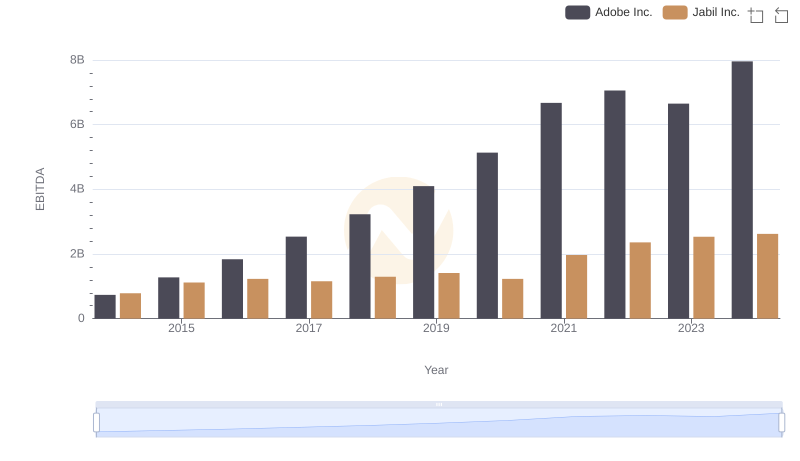
EBITDA Analysis: Evaluating Adobe Inc. Against Jabil Inc.
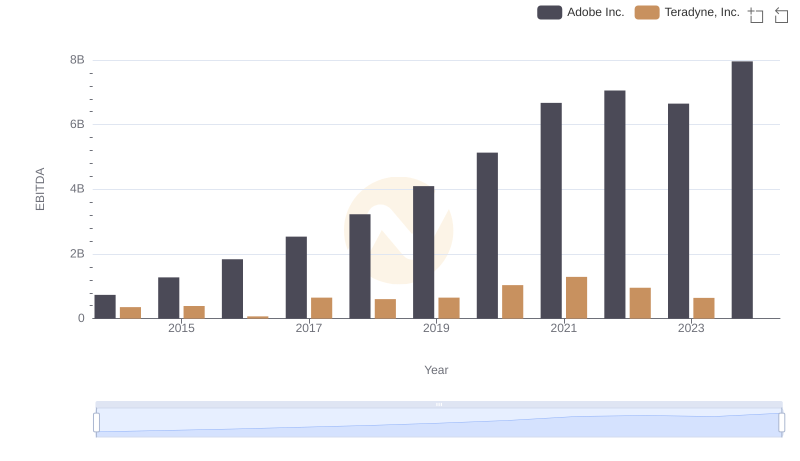
EBITDA Analysis: Evaluating Adobe Inc. Against Teradyne, Inc.
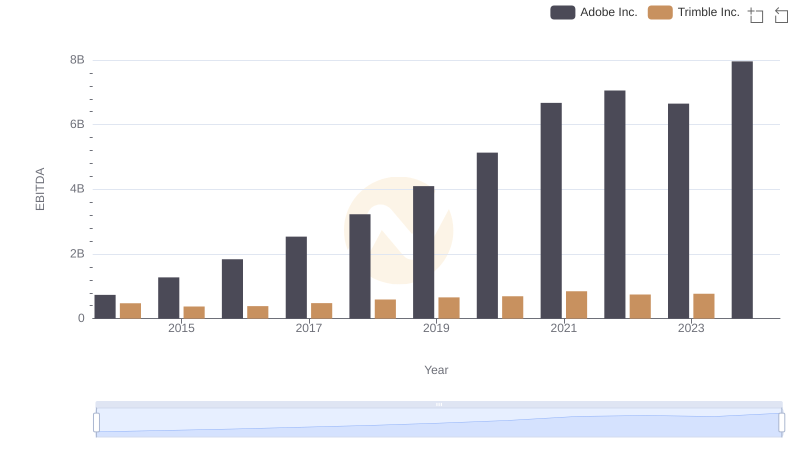
Professional EBITDA Benchmarking: Adobe Inc. vs Trimble Inc.