| __timestamp | Builders FirstSource, Inc. | Equifax Inc. |
|---|---|---|
| Wednesday, January 1, 2014 | 60008000 | 842400000 |
| Thursday, January 1, 2015 | 148897000 | 914600000 |
| Friday, January 1, 2016 | 346129000 | 1116900000 |
| Sunday, January 1, 2017 | 378096000 | 1013900000 |
| Monday, January 1, 2018 | 466874000 | 770200000 |
| Tuesday, January 1, 2019 | 492344000 | 29000000 |
| Wednesday, January 1, 2020 | 660420000 | 1217800000 |
| Friday, January 1, 2021 | 2934776000 | 1575200000 |
| Saturday, January 1, 2022 | 4267346000 | 1672800000 |
| Sunday, January 1, 2023 | 2734594000 | 1579100000 |
| Monday, January 1, 2024 | 1251200000 |
Unveiling the hidden dimensions of data
In the ever-evolving landscape of American business, Equifax Inc. and Builders FirstSource, Inc. have showcased remarkable financial trajectories over the past decade. From 2014 to 2023, Builders FirstSource, Inc. has seen a staggering growth in EBITDA, peaking at over 4.3 billion in 2022, a nearly 70-fold increase from its 2014 figures. This growth trajectory highlights the company's strategic expansions and market adaptability.
Conversely, Equifax Inc. has maintained a steady EBITDA growth, with a notable peak in 2022 at approximately 1.67 billion, reflecting a 98% increase from its 2014 performance. Despite a dip in 2019, Equifax's resilience is evident in its recovery and subsequent growth.
This comparative analysis underscores the dynamic nature of these industries, with Builders FirstSource capitalizing on construction booms and Equifax navigating the complexities of data services.
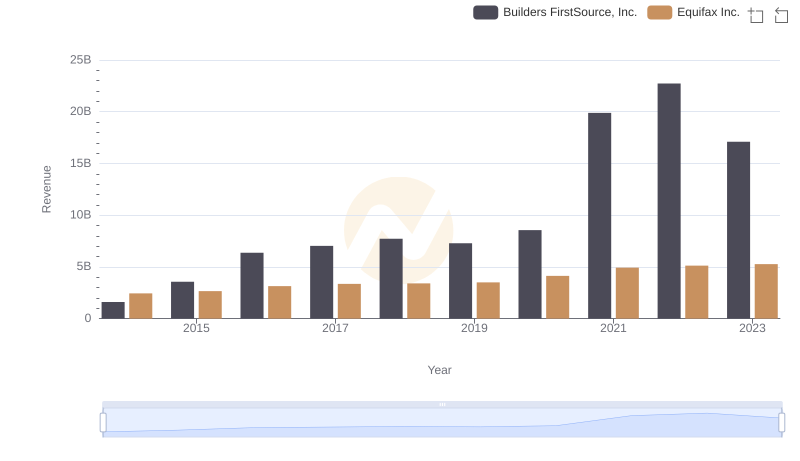
Annual Revenue Comparison: Equifax Inc. vs Builders FirstSource, Inc.
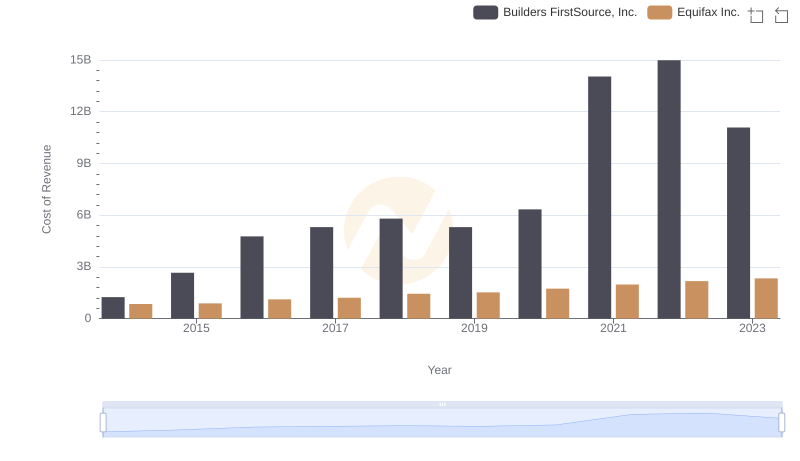
Cost Insights: Breaking Down Equifax Inc. and Builders FirstSource, Inc.'s Expenses
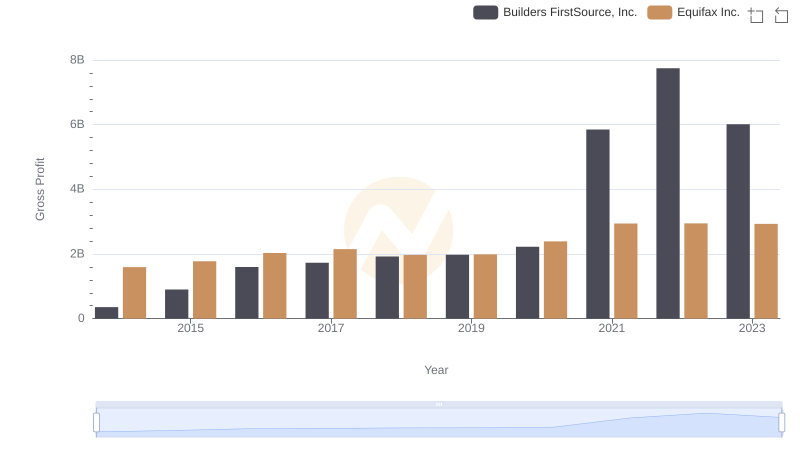
Key Insights on Gross Profit: Equifax Inc. vs Builders FirstSource, Inc.
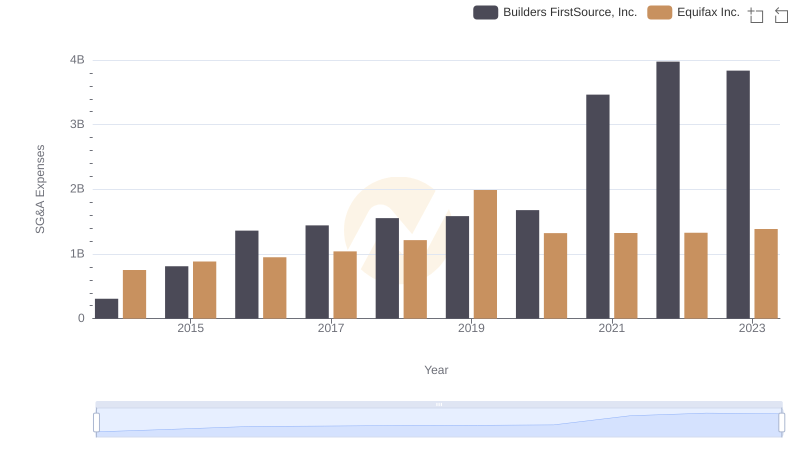
Selling, General, and Administrative Costs: Equifax Inc. vs Builders FirstSource, Inc.
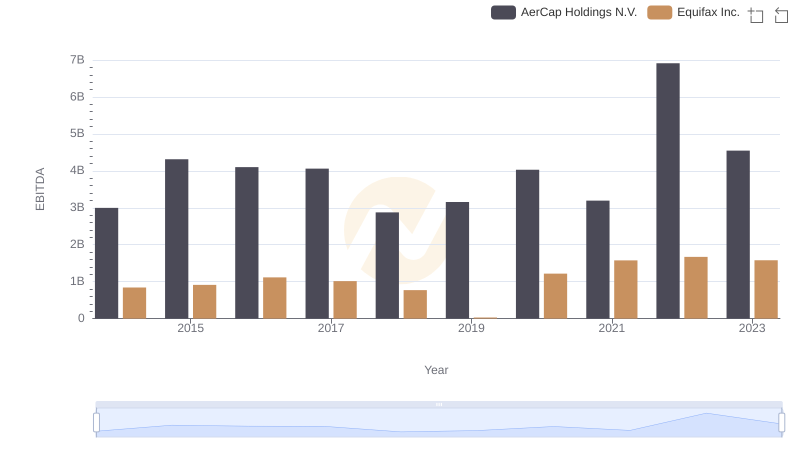
A Side-by-Side Analysis of EBITDA: Equifax Inc. and AerCap Holdings N.V.
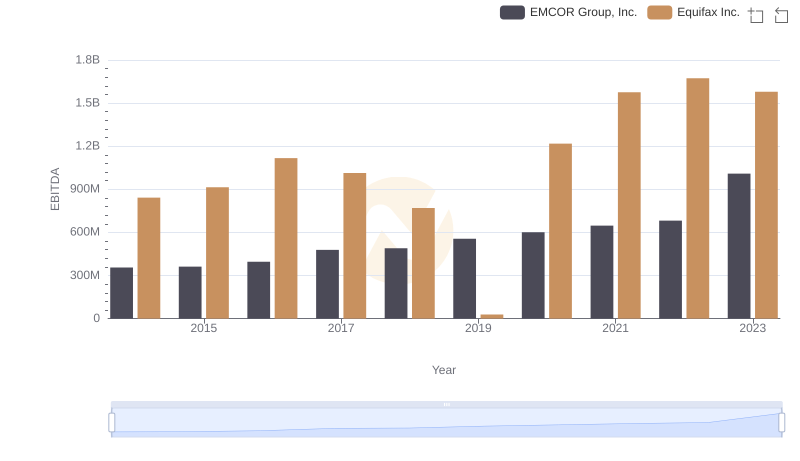
Equifax Inc. and EMCOR Group, Inc.: A Detailed Examination of EBITDA Performance