| __timestamp | Equifax Inc. | Pool Corporation |
|---|---|---|
| Wednesday, January 1, 2014 | 842400000 | 204752000 |
| Thursday, January 1, 2015 | 914600000 | 233610000 |
| Friday, January 1, 2016 | 1116900000 | 277836000 |
| Sunday, January 1, 2017 | 1013900000 | 310096000 |
| Monday, January 1, 2018 | 770200000 | 341804000 |
| Tuesday, January 1, 2019 | 29000000 | 370520000 |
| Wednesday, January 1, 2020 | 1217800000 | 493425000 |
| Friday, January 1, 2021 | 1575200000 | 862810000 |
| Saturday, January 1, 2022 | 1672800000 | 1064808000 |
| Sunday, January 1, 2023 | 1579100000 | 786707000 |
| Monday, January 1, 2024 | 1251200000 |
Unlocking the unknown
Over the past decade, Equifax Inc. and Pool Corporation have showcased intriguing EBITDA trends, reflecting their financial health and operational efficiency. From 2014 to 2023, Equifax's EBITDA grew by approximately 87%, peaking in 2022. This growth trajectory highlights Equifax's resilience and strategic prowess in the competitive credit reporting industry.
Conversely, Pool Corporation, a leader in the pool supply sector, demonstrated a remarkable 420% increase in EBITDA over the same period. This surge underscores the company's robust market position and adaptability, especially during the pandemic years when home improvement projects soared.
In 2019, Equifax experienced a significant dip, with EBITDA plummeting to just 3% of its 2022 peak, likely due to the aftermath of its 2017 data breach. Meanwhile, Pool Corporation steadily climbed, reflecting consistent demand for its products. These insights offer a compelling narrative of two industry giants navigating economic challenges and opportunities.
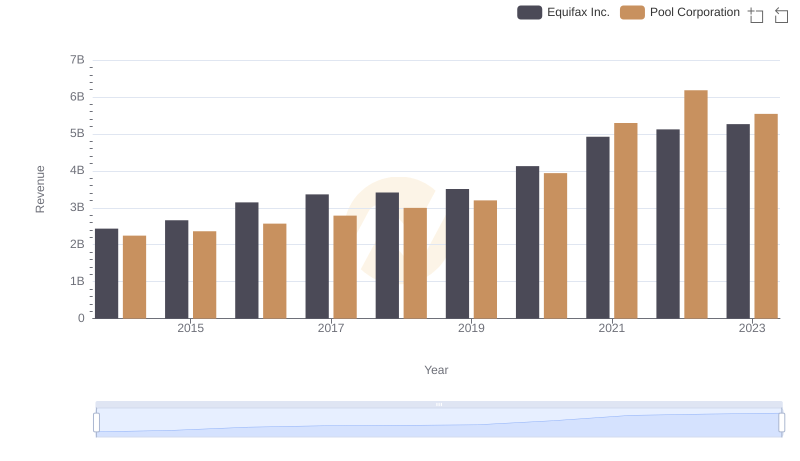
Comparing Revenue Performance: Equifax Inc. or Pool Corporation?
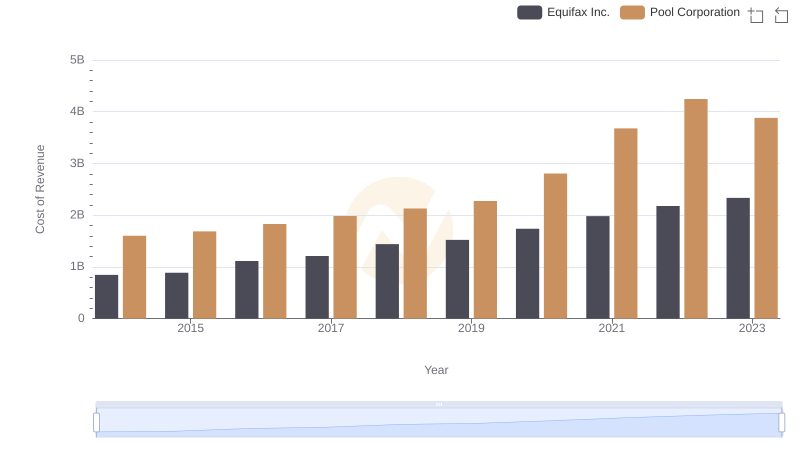
Cost of Revenue Comparison: Equifax Inc. vs Pool Corporation
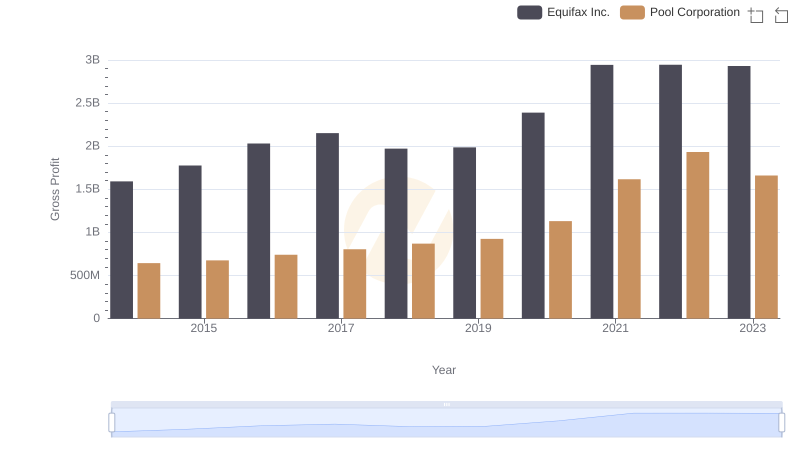
Gross Profit Comparison: Equifax Inc. and Pool Corporation Trends
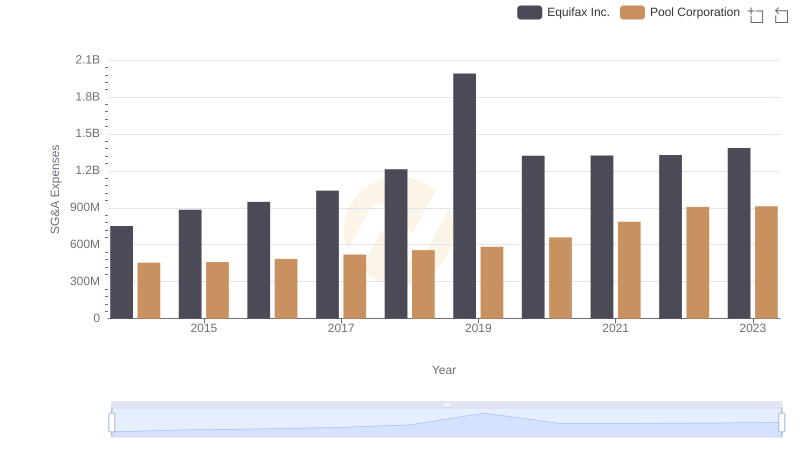
Comparing SG&A Expenses: Equifax Inc. vs Pool Corporation Trends and Insights
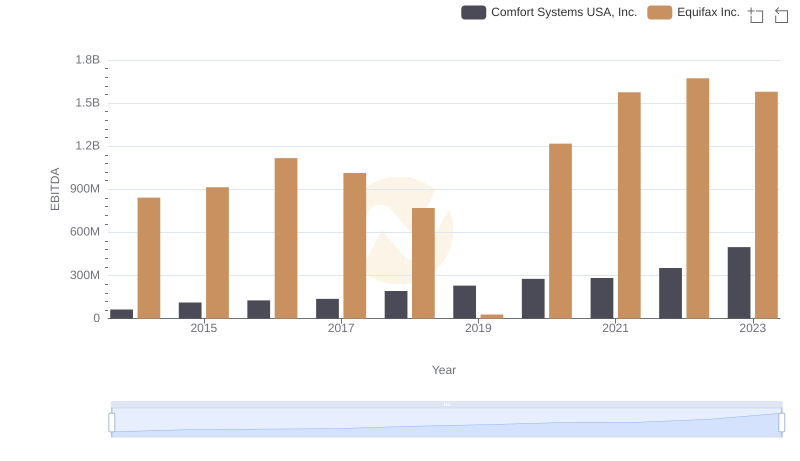
EBITDA Analysis: Evaluating Equifax Inc. Against Comfort Systems USA, Inc.
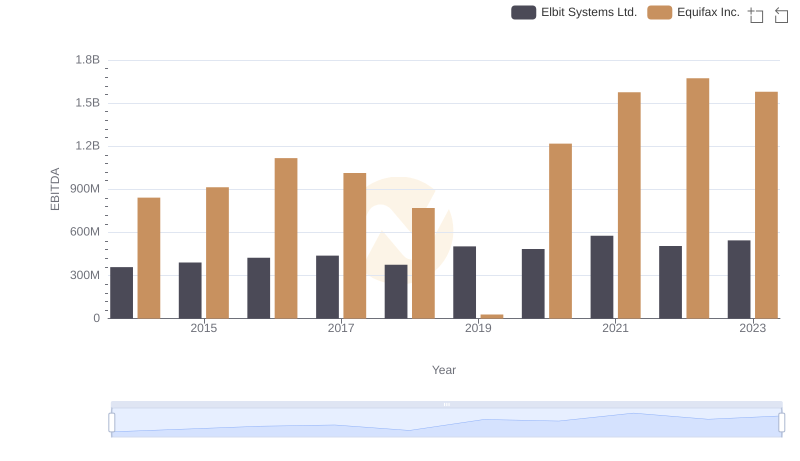
Comparative EBITDA Analysis: Equifax Inc. vs Elbit Systems Ltd.