| __timestamp | Equifax Inc. | Pool Corporation |
|---|---|---|
| Wednesday, January 1, 2014 | 2436400000 | 2246562000 |
| Thursday, January 1, 2015 | 2663600000 | 2363139000 |
| Friday, January 1, 2016 | 3144900000 | 2570803000 |
| Sunday, January 1, 2017 | 3362200000 | 2788188000 |
| Monday, January 1, 2018 | 3412100000 | 2998097000 |
| Tuesday, January 1, 2019 | 3507600000 | 3199517000 |
| Wednesday, January 1, 2020 | 4127500000 | 3936623000 |
| Friday, January 1, 2021 | 4923900000 | 5295584000 |
| Saturday, January 1, 2022 | 5122200000 | 6179727000 |
| Sunday, January 1, 2023 | 5265200000 | 5541595000 |
| Monday, January 1, 2024 | 5681100000 |
Unleashing insights
In the ever-evolving landscape of American business, Equifax Inc. and Pool Corporation have demonstrated remarkable revenue growth over the past decade. From 2014 to 2023, Equifax's revenue surged by over 116%, starting at approximately $2.4 billion and reaching $5.3 billion. Meanwhile, Pool Corporation, a leader in the pool supply industry, saw its revenue grow by an impressive 147%, from $2.2 billion to $5.5 billion.
These trends underscore the dynamic nature of these industries and their ability to thrive amidst economic challenges.
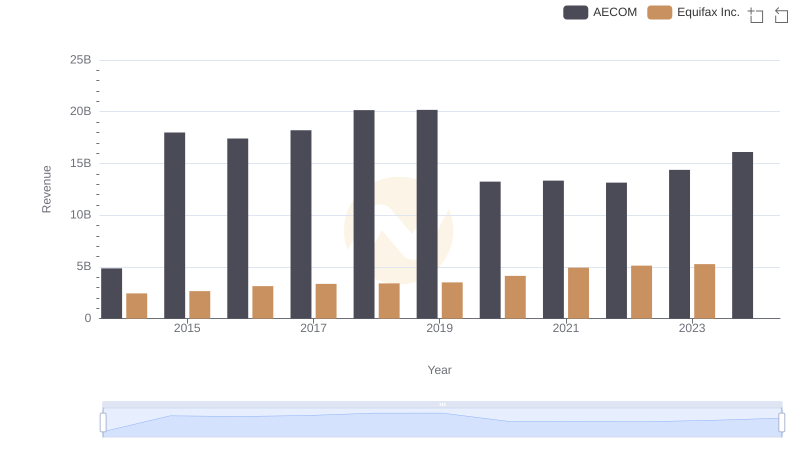
Breaking Down Revenue Trends: Equifax Inc. vs AECOM
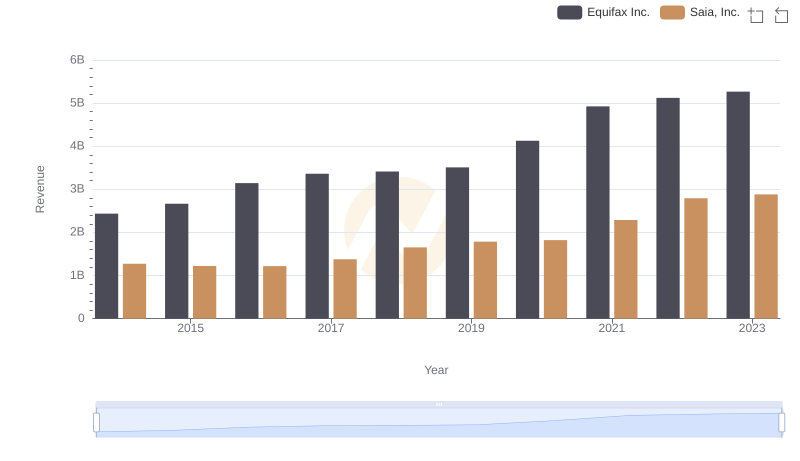
Comparing Revenue Performance: Equifax Inc. or Saia, Inc.?
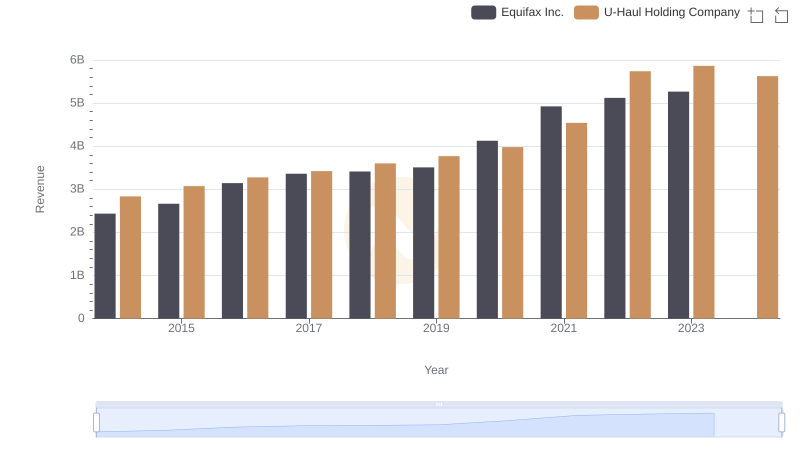
Equifax Inc. or U-Haul Holding Company: Who Leads in Yearly Revenue?
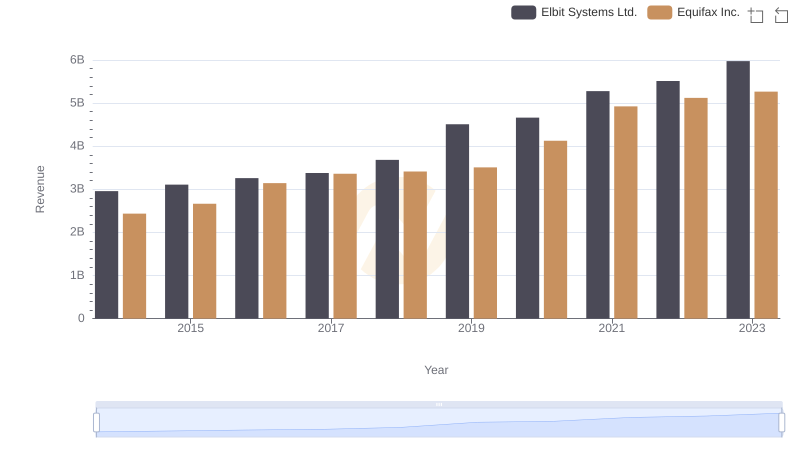
Equifax Inc. or Elbit Systems Ltd.: Who Leads in Yearly Revenue?
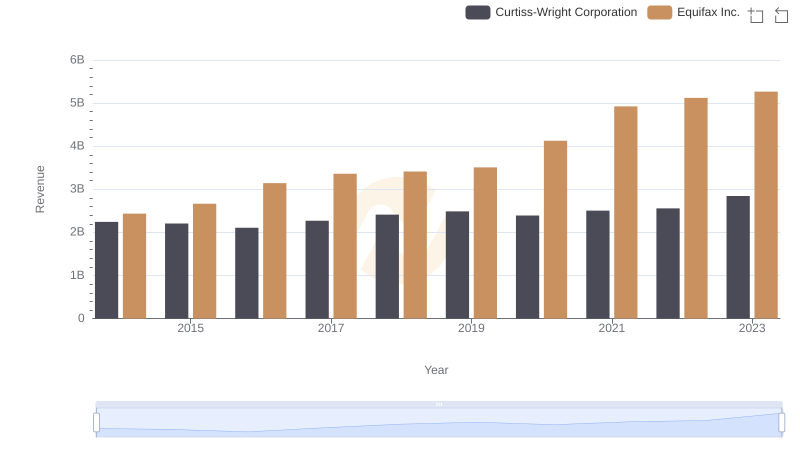
Breaking Down Revenue Trends: Equifax Inc. vs Curtiss-Wright Corporation
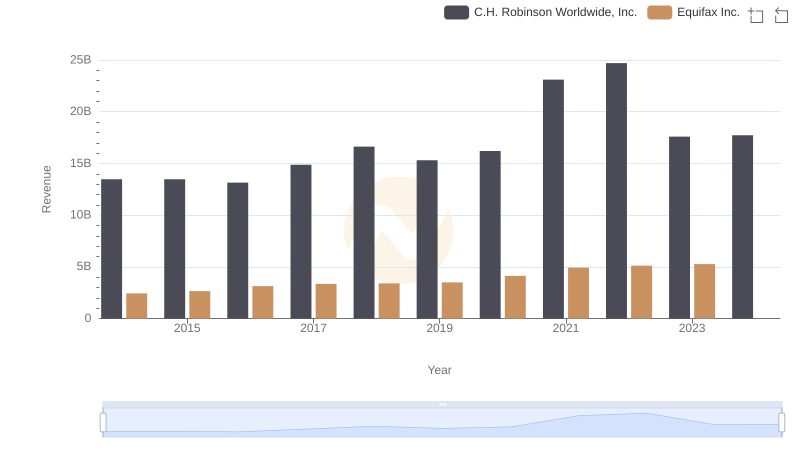
Annual Revenue Comparison: Equifax Inc. vs C.H. Robinson Worldwide, Inc.
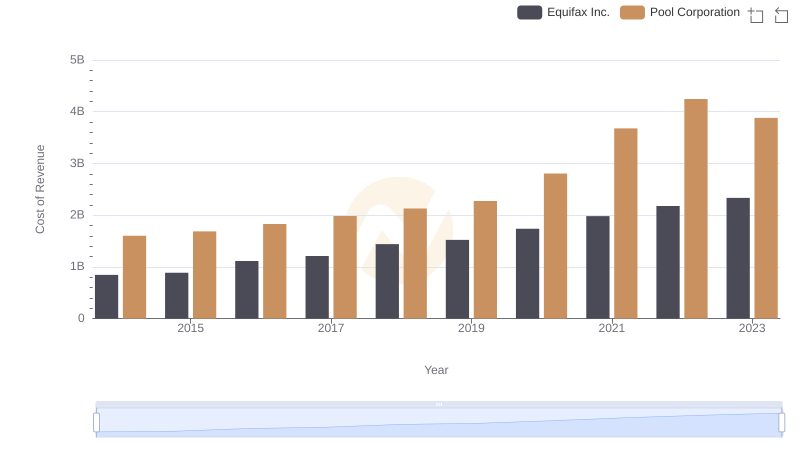
Cost of Revenue Comparison: Equifax Inc. vs Pool Corporation
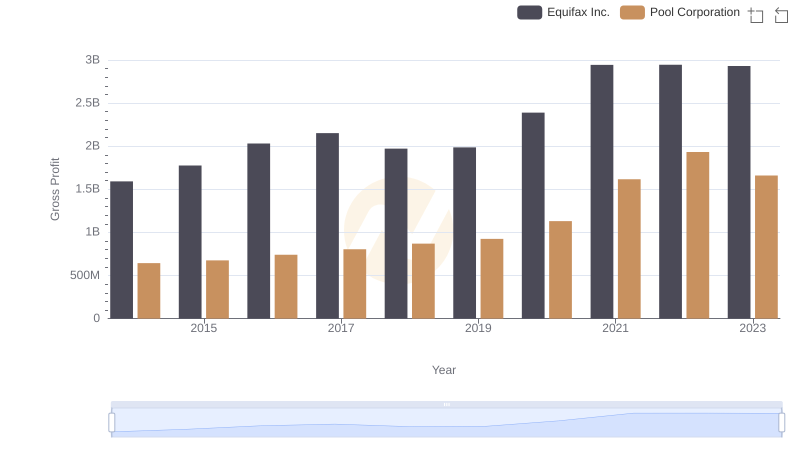
Gross Profit Comparison: Equifax Inc. and Pool Corporation Trends
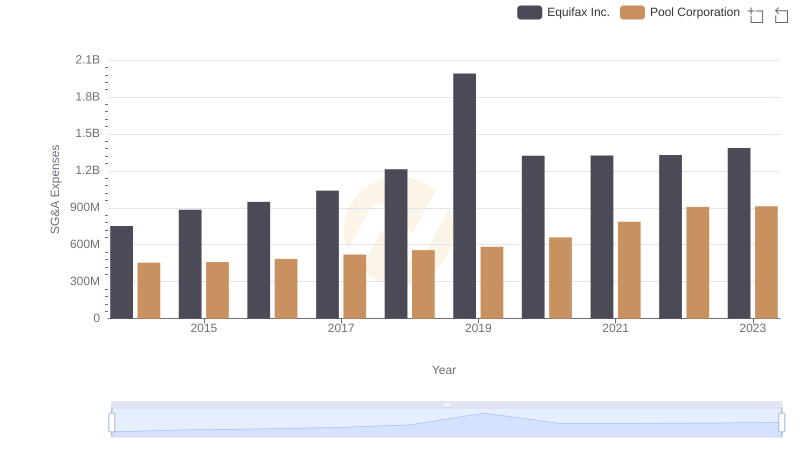
Comparing SG&A Expenses: Equifax Inc. vs Pool Corporation Trends and Insights
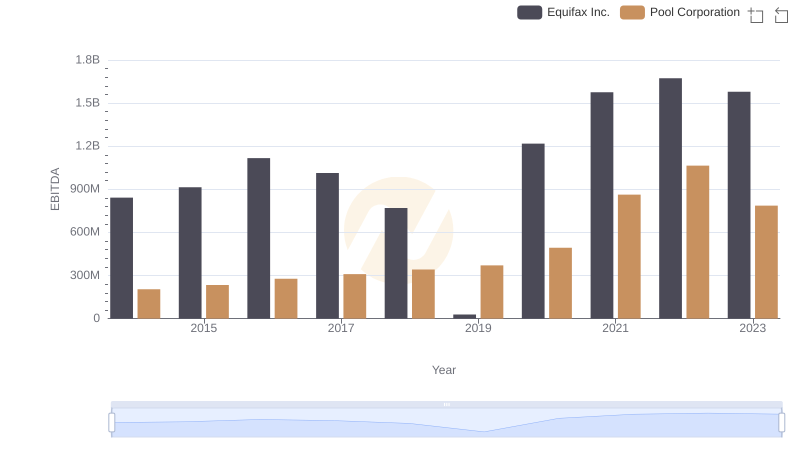
EBITDA Analysis: Evaluating Equifax Inc. Against Pool Corporation