| __timestamp | Elbit Systems Ltd. | Equifax Inc. |
|---|---|---|
| Wednesday, January 1, 2014 | 358274000 | 842400000 |
| Thursday, January 1, 2015 | 390932000 | 914600000 |
| Friday, January 1, 2016 | 424003291 | 1116900000 |
| Sunday, January 1, 2017 | 438616108 | 1013900000 |
| Monday, January 1, 2018 | 374866620 | 770200000 |
| Tuesday, January 1, 2019 | 502866000 | 29000000 |
| Wednesday, January 1, 2020 | 484464000 | 1217800000 |
| Friday, January 1, 2021 | 576645646 | 1575200000 |
| Saturday, January 1, 2022 | 505269000 | 1672800000 |
| Sunday, January 1, 2023 | 544811000 | 1579100000 |
| Monday, January 1, 2024 | 1251200000 |
Cracking the code
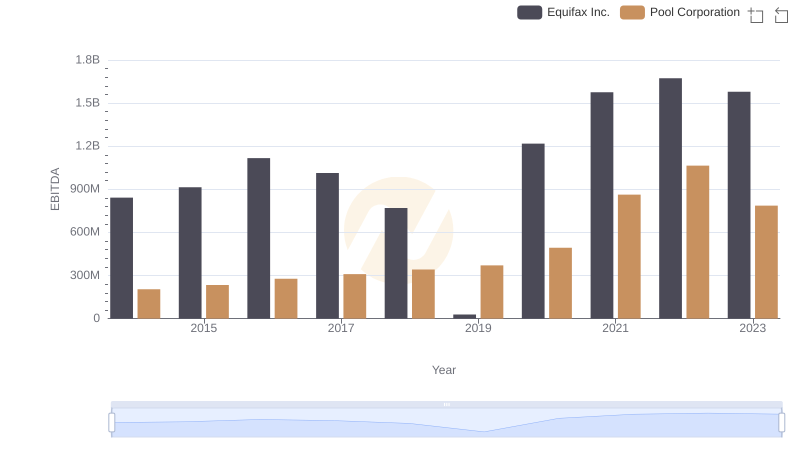
In the ever-evolving landscape of global business, understanding financial health is paramount. This analysis delves into the EBITDA performance of Equifax Inc. and Elbit Systems Ltd. from 2014 to 2023. Over this period, Equifax Inc. consistently outperformed Elbit Systems Ltd., with an average EBITDA nearly 2.3 times higher. Notably, Equifax's EBITDA peaked in 2022, reaching approximately 1.67 billion, a 98% increase from its 2014 figures. Meanwhile, Elbit Systems Ltd. demonstrated steady growth, with its EBITDA increasing by about 52% over the same period. The data reveals a significant dip for Equifax in 2019, with an EBITDA of just 29 million, highlighting potential challenges faced during that year. This comparative analysis underscores the resilience and growth trajectories of these industry giants, offering valuable insights for investors and stakeholders alike.
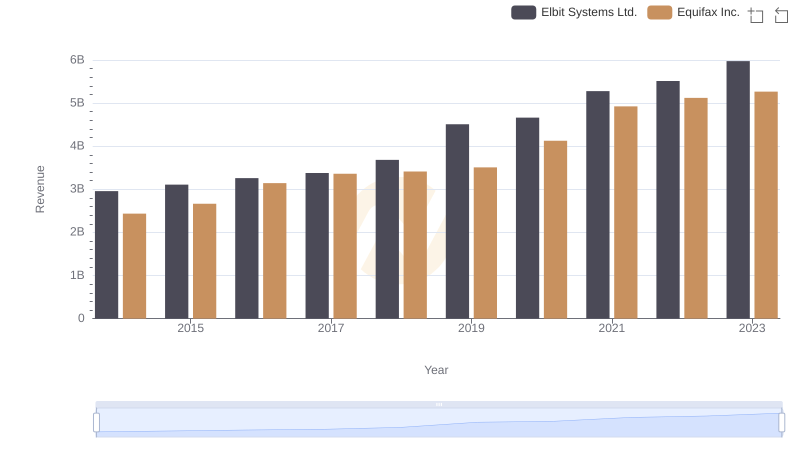
Equifax Inc. or Elbit Systems Ltd.: Who Leads in Yearly Revenue?
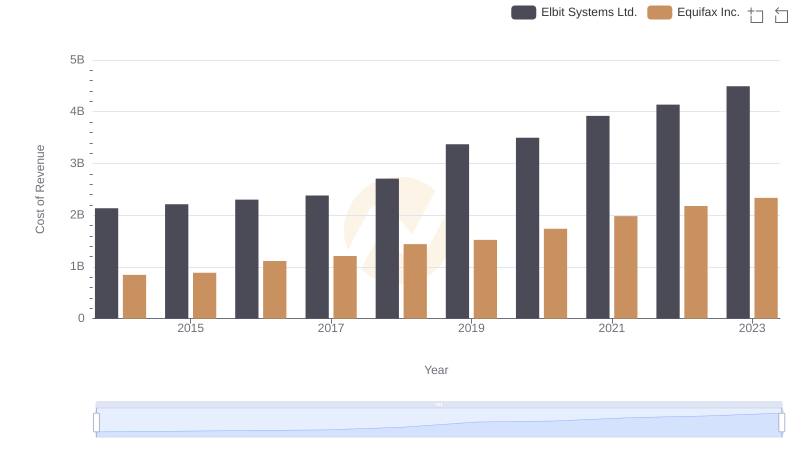
Cost of Revenue Comparison: Equifax Inc. vs Elbit Systems Ltd.
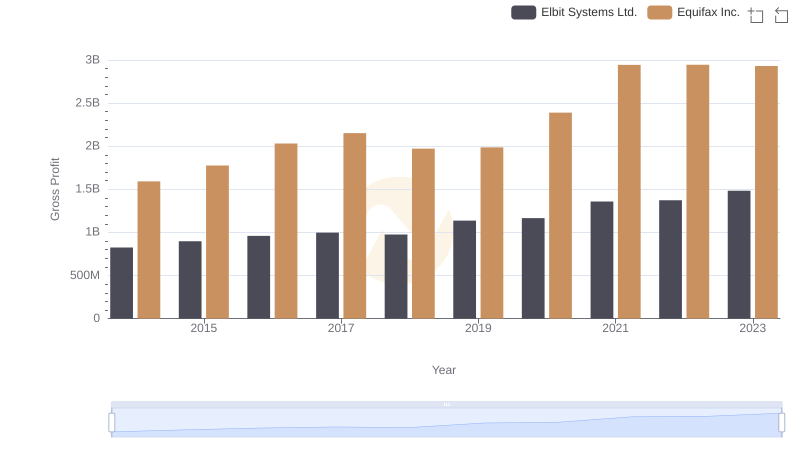
Gross Profit Analysis: Comparing Equifax Inc. and Elbit Systems Ltd.
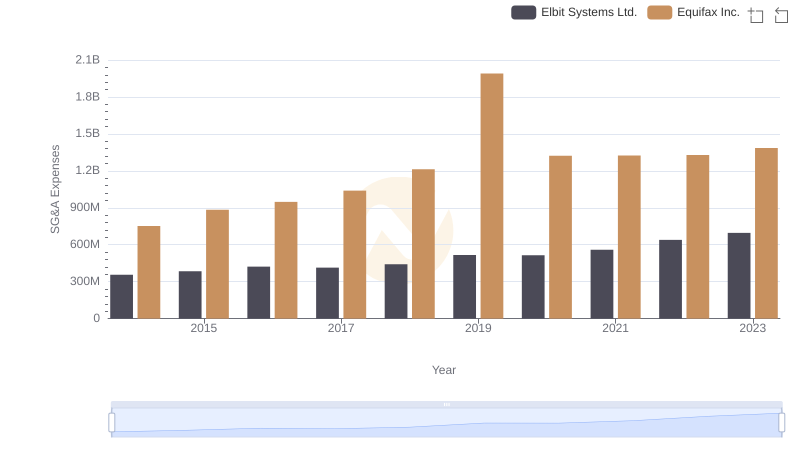
Operational Costs Compared: SG&A Analysis of Equifax Inc. and Elbit Systems Ltd.
EBITDA Analysis: Evaluating Equifax Inc. Against Pool Corporation