| __timestamp | Comfort Systems USA, Inc. | Equifax Inc. |
|---|---|---|
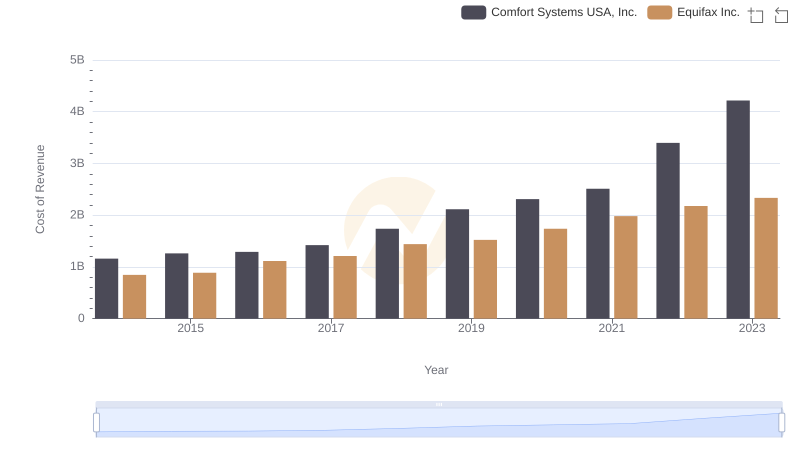
| Wednesday, January 1, 2014 | 63455000 | 842400000 |
| Thursday, January 1, 2015 | 112580000 | 914600000 |
| Friday, January 1, 2016 | 126974000 | 1116900000 |
| Sunday, January 1, 2017 | 137151000 | 1013900000 |
| Monday, January 1, 2018 | 191982000 | 770200000 |
| Tuesday, January 1, 2019 | 229518000 | 29000000 |
| Wednesday, January 1, 2020 | 276904000 | 1217800000 |
| Friday, January 1, 2021 | 282506000 | 1575200000 |
| Saturday, January 1, 2022 | 352446000 | 1672800000 |
| Sunday, January 1, 2023 | 497652000 | 1579100000 |
| Monday, January 1, 2024 | 1251200000 |
Cracking the code
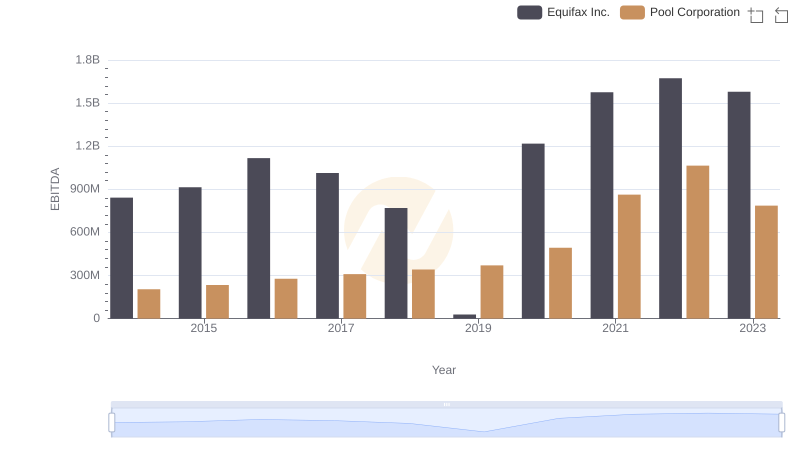
In the ever-evolving landscape of corporate finance, EBITDA (Earnings Before Interest, Taxes, Depreciation, and Amortization) serves as a crucial metric for evaluating a company's operational performance. Over the past decade, Equifax Inc. and Comfort Systems USA, Inc. have demonstrated contrasting trajectories in their EBITDA growth.
From 2014 to 2023, Equifax Inc. consistently outperformed Comfort Systems USA, Inc., with an average EBITDA nearly five times higher. Notably, Equifax's EBITDA peaked in 2022, reaching approximately 1.67 billion, a testament to its robust financial health. In contrast, Comfort Systems USA, Inc. showed a steady upward trend, culminating in a remarkable 685% increase from 2014 to 2023.
This analysis underscores the dynamic nature of financial performance, highlighting Equifax's dominance and Comfort Systems' impressive growth trajectory. Investors and analysts alike can glean valuable insights from these trends, informing strategic decisions in the competitive world of finance.