| __timestamp | Masco Corporation | Union Pacific Corporation |
|---|---|---|
| Wednesday, January 1, 2014 | 8521000000 | 23988000000 |
| Thursday, January 1, 2015 | 7142000000 | 21813000000 |
| Friday, January 1, 2016 | 7357000000 | 19941000000 |
| Sunday, January 1, 2017 | 7644000000 | 21240000000 |
| Monday, January 1, 2018 | 8359000000 | 22832000000 |
| Tuesday, January 1, 2019 | 6707000000 | 21708000000 |
| Wednesday, January 1, 2020 | 7188000000 | 19533000000 |
| Friday, January 1, 2021 | 8375000000 | 21804000000 |
| Saturday, January 1, 2022 | 8680000000 | 24875000000 |
| Sunday, January 1, 2023 | 7967000000 | 24119000000 |
| Monday, January 1, 2024 | 7828000000 | 24250000000 |
Igniting the spark of knowledge
In the ever-evolving landscape of American industry, Union Pacific Corporation and Masco Corporation stand as titans in their respective fields. Over the past decade, Union Pacific, a leader in rail transportation, has consistently outperformed Masco, a key player in home improvement and building products, in terms of annual revenue.
From 2014 to 2023, Union Pacific's revenue has shown a robust upward trajectory, peaking in 2022 with a remarkable 25% increase from its 2016 low. In contrast, Masco's revenue has experienced more volatility, with a notable dip in 2019, followed by a recovery in 2022, reaching its highest point in the decade.
While Union Pacific's revenue growth reflects the resilience of the transportation sector, Masco's fluctuations highlight the challenges and opportunities within the home improvement market. As we look to the future, these trends offer valuable insights into the economic forces shaping these industries.

Union Pacific Corporation vs Watsco, Inc.: Examining Key Revenue Metrics
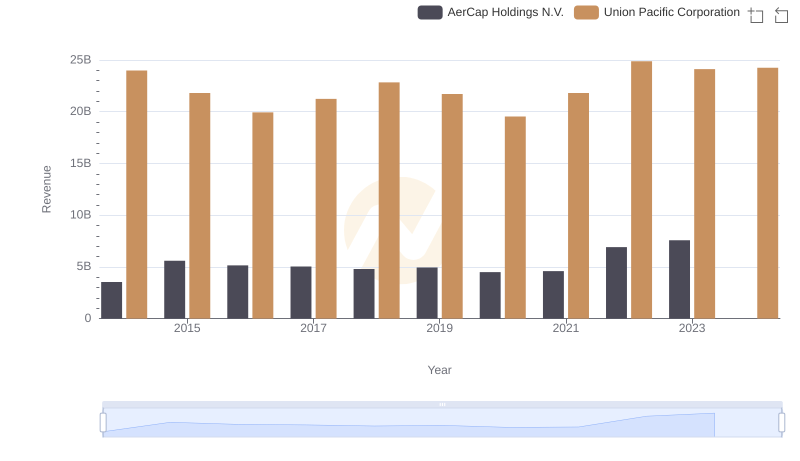
Union Pacific Corporation or AerCap Holdings N.V.: Who Leads in Yearly Revenue?
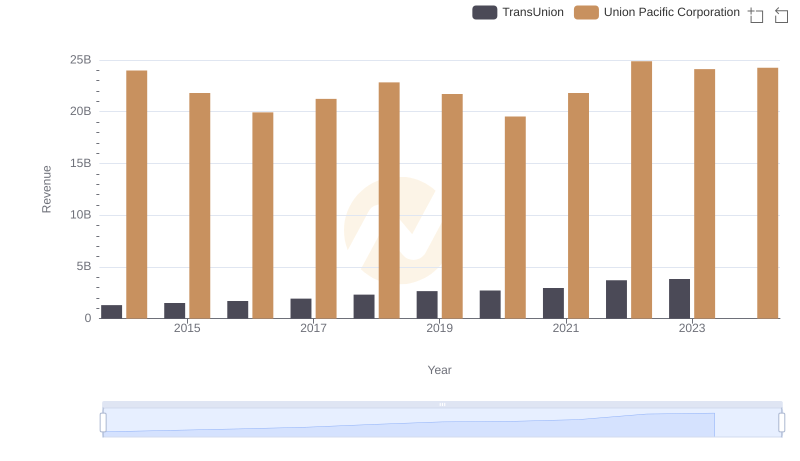
Who Generates More Revenue? Union Pacific Corporation or TransUnion
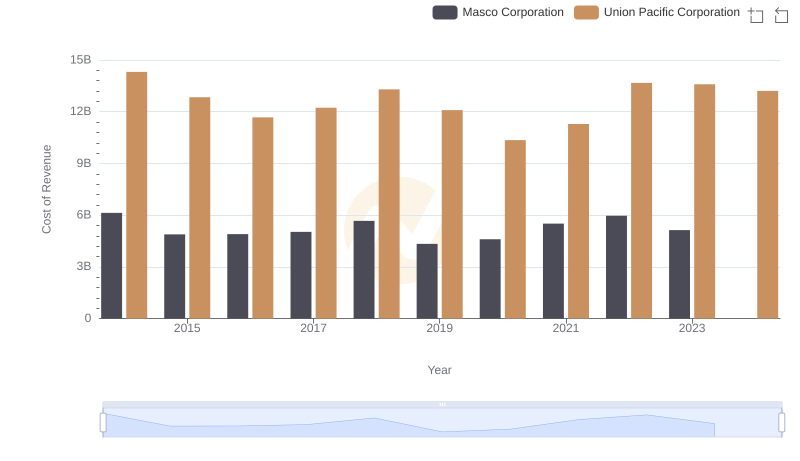
Cost of Revenue Trends: Union Pacific Corporation vs Masco Corporation
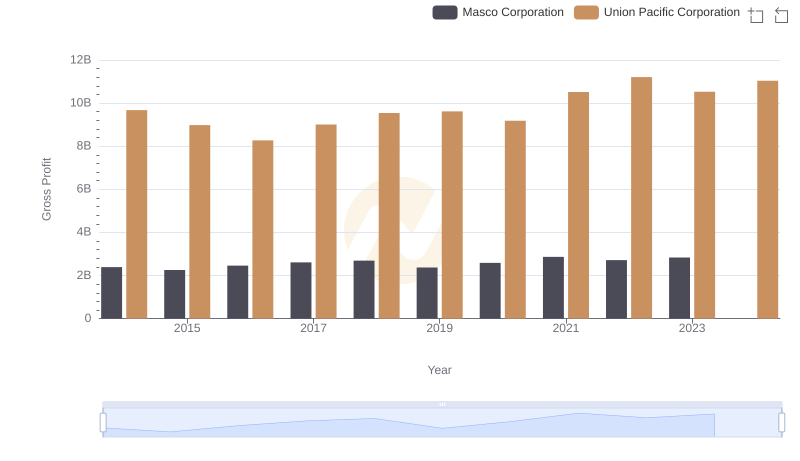
Union Pacific Corporation and Masco Corporation: A Detailed Gross Profit Analysis
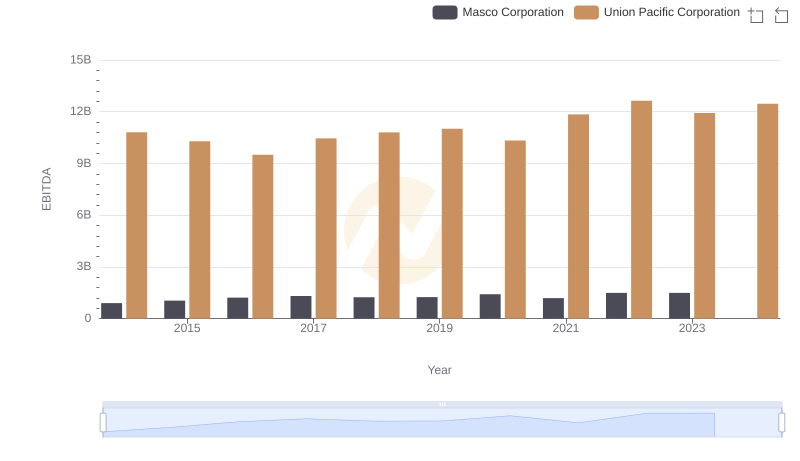
A Professional Review of EBITDA: Union Pacific Corporation Compared to Masco Corporation