| __timestamp | Masco Corporation | Union Pacific Corporation |
|---|---|---|
| Wednesday, January 1, 2014 | 899000000 | 10808000000 |
| Thursday, January 1, 2015 | 1041000000 | 10290000000 |
| Friday, January 1, 2016 | 1220000000 | 9502000000 |
| Sunday, January 1, 2017 | 1314000000 | 10456000000 |
| Monday, January 1, 2018 | 1240000000 | 10802000000 |
| Tuesday, January 1, 2019 | 1244000000 | 11013000000 |
| Wednesday, January 1, 2020 | 1410000000 | 10331000000 |
| Friday, January 1, 2021 | 1185000000 | 11843000000 |
| Saturday, January 1, 2022 | 1490000000 | 12636000000 |
| Sunday, January 1, 2023 | 1493000000 | 11928000000 |
| Monday, January 1, 2024 | 1410000000 | 12461000000 |
Infusing magic into the data realm
In the ever-evolving landscape of American industry, Union Pacific Corporation and Masco Corporation stand as titans in their respective fields. From 2014 to 2023, Union Pacific's EBITDA consistently outpaced Masco's, showcasing its robust financial health. Union Pacific's EBITDA peaked in 2022, reaching approximately 12.6 billion, a 33% increase from its 2016 low. Meanwhile, Masco's EBITDA saw a steady rise, culminating in a 66% increase from 2014 to 2023, despite a slight dip in 2021. This data highlights Union Pacific's dominance in the transportation sector, while Masco's growth reflects resilience in the home improvement industry. Notably, 2024 data for Masco is missing, leaving room for speculation on its future trajectory. This analysis underscores the importance of strategic financial management in maintaining competitive advantage.
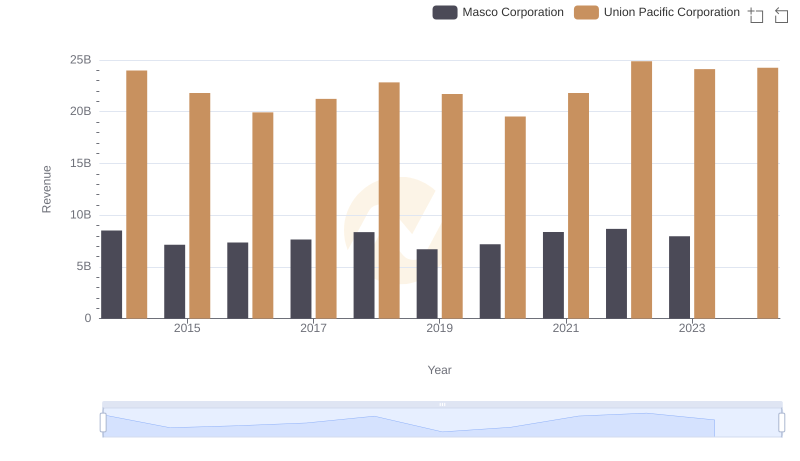
Annual Revenue Comparison: Union Pacific Corporation vs Masco Corporation
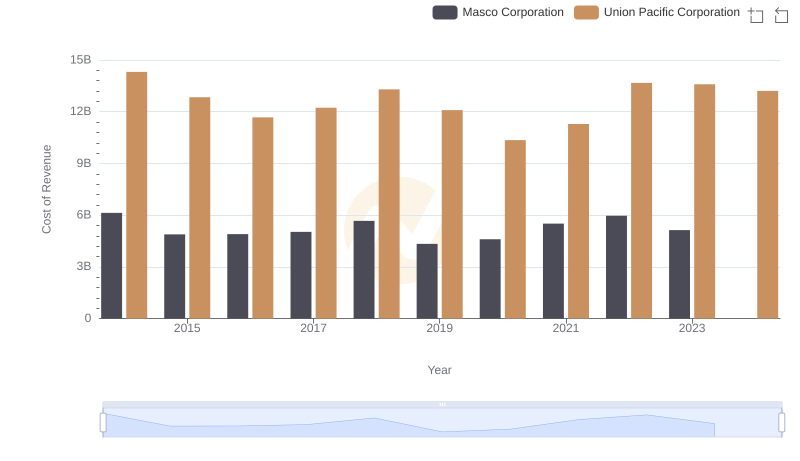
Cost of Revenue Trends: Union Pacific Corporation vs Masco Corporation
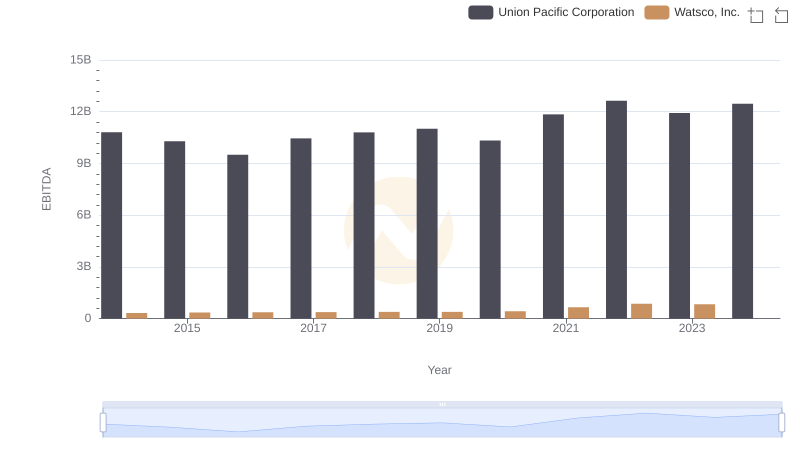
Comparative EBITDA Analysis: Union Pacific Corporation vs Watsco, Inc.
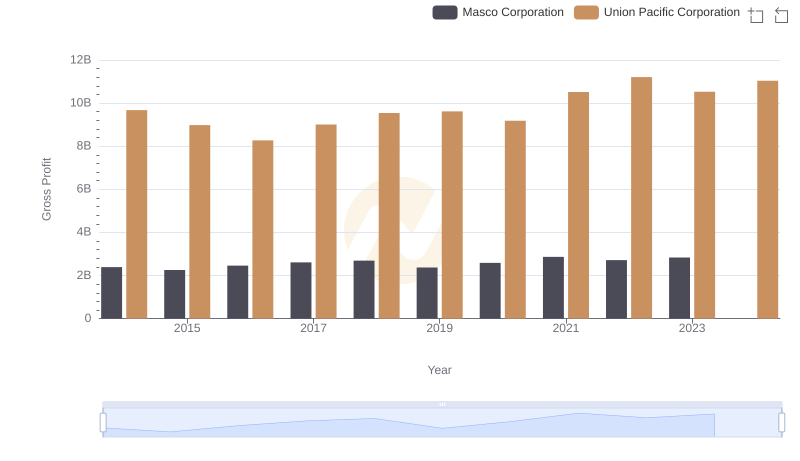
Union Pacific Corporation and Masco Corporation: A Detailed Gross Profit Analysis
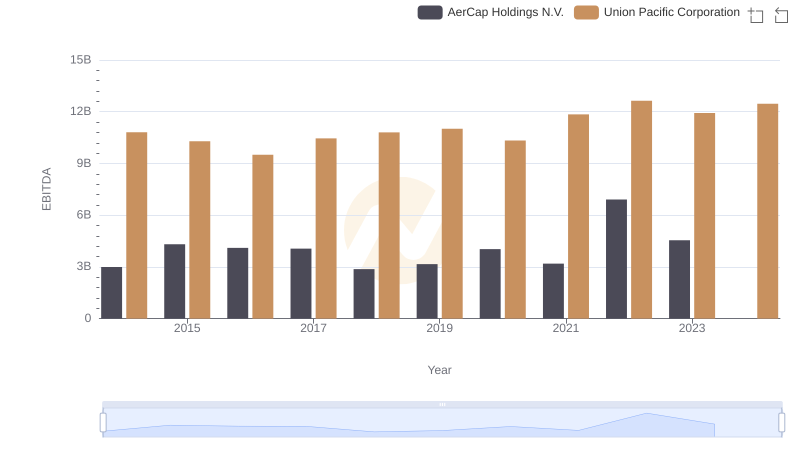
Comparative EBITDA Analysis: Union Pacific Corporation vs AerCap Holdings N.V.
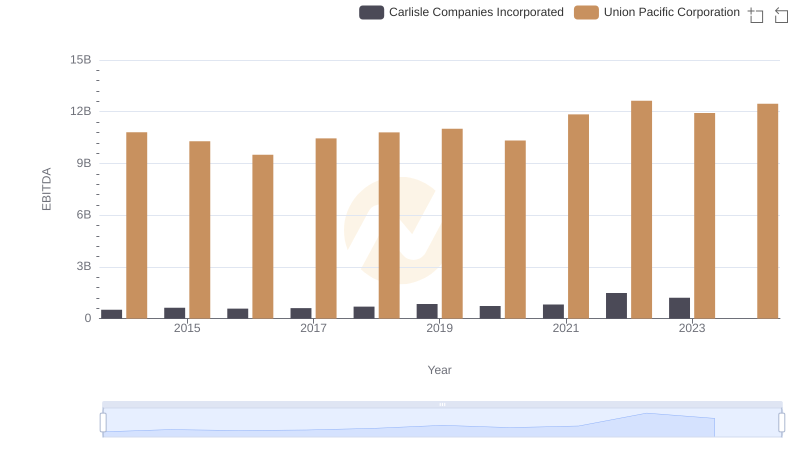
A Side-by-Side Analysis of EBITDA: Union Pacific Corporation and Carlisle Companies Incorporated
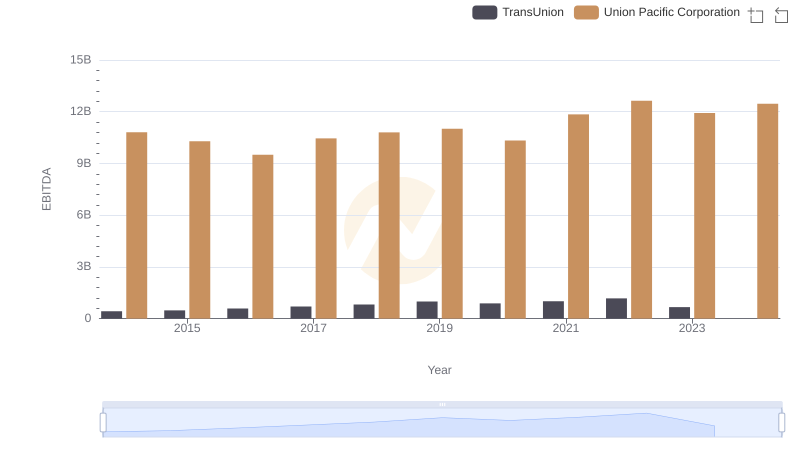
EBITDA Analysis: Evaluating Union Pacific Corporation Against TransUnion
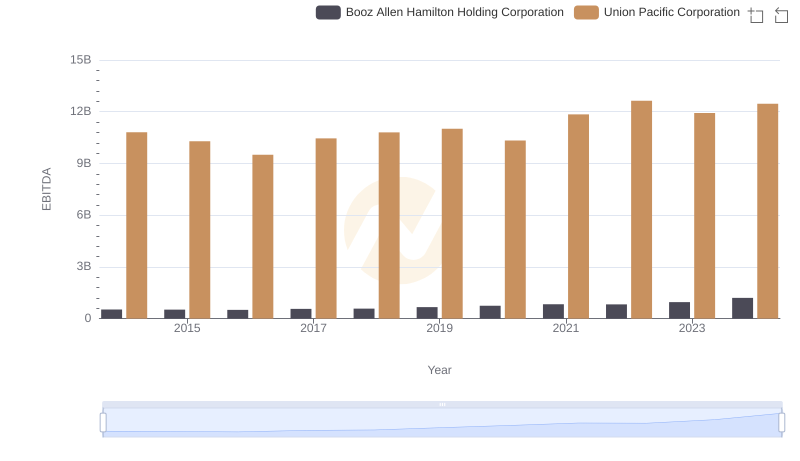
A Side-by-Side Analysis of EBITDA: Union Pacific Corporation and Booz Allen Hamilton Holding Corporation

Comprehensive EBITDA Comparison: Union Pacific Corporation vs Jacobs Engineering Group Inc.