| __timestamp | TransUnion | Union Pacific Corporation |
|---|---|---|
| Wednesday, January 1, 2014 | 499100000 | 14311000000 |
| Thursday, January 1, 2015 | 531600000 | 12837000000 |
| Friday, January 1, 2016 | 579100000 | 11672000000 |
| Sunday, January 1, 2017 | 645700000 | 12231000000 |
| Monday, January 1, 2018 | 790100000 | 13293000000 |
| Tuesday, January 1, 2019 | 874100000 | 12094000000 |
| Wednesday, January 1, 2020 | 920400000 | 10354000000 |
| Friday, January 1, 2021 | 991600000 | 11290000000 |
| Saturday, January 1, 2022 | 1222900000 | 13670000000 |
| Sunday, January 1, 2023 | 1517300000 | 13590000000 |
| Monday, January 1, 2024 | 0 | 13211000000 |
In pursuit of knowledge
In the ever-evolving landscape of corporate efficiency, the cost of revenue is a critical metric. Union Pacific Corporation, a titan in the transportation sector, and TransUnion, a leader in credit reporting, offer a fascinating comparison. From 2014 to 2023, Union Pacific consistently maintained a higher cost of revenue, peaking in 2014 with approximately $14.3 billion. However, by 2023, this figure had decreased by about 5% to $13.6 billion, indicating a strategic shift towards cost efficiency.
Conversely, TransUnion's cost of revenue has shown a steady upward trend, increasing by over 200% from 2014 to 2023, reaching approximately $1.5 billion. This growth reflects TransUnion's expanding operations and market reach. Notably, the data for 2024 is incomplete, highlighting the dynamic nature of financial forecasting. This analysis underscores the diverse strategies employed by these industry giants in managing their operational costs.
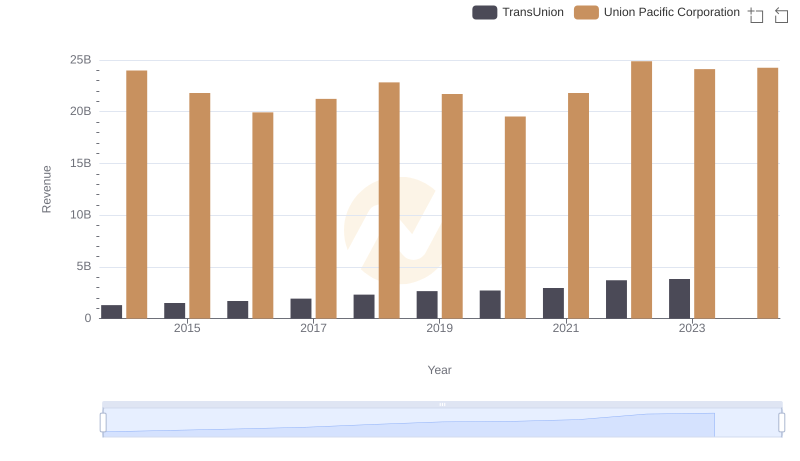
Who Generates More Revenue? Union Pacific Corporation or TransUnion
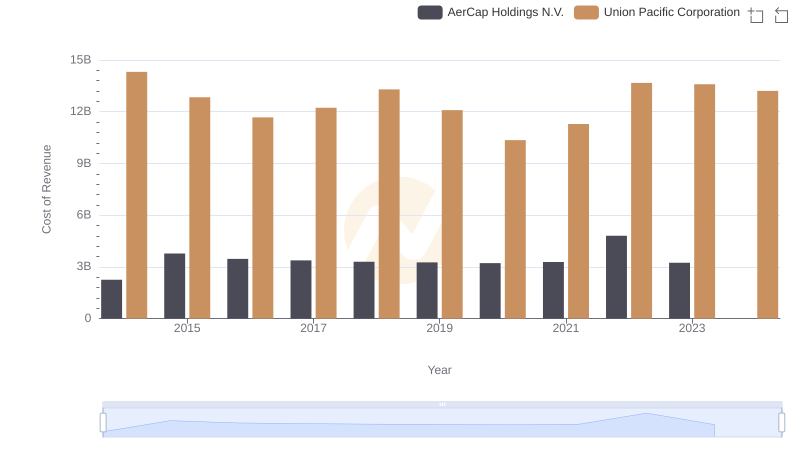
Analyzing Cost of Revenue: Union Pacific Corporation and AerCap Holdings N.V.
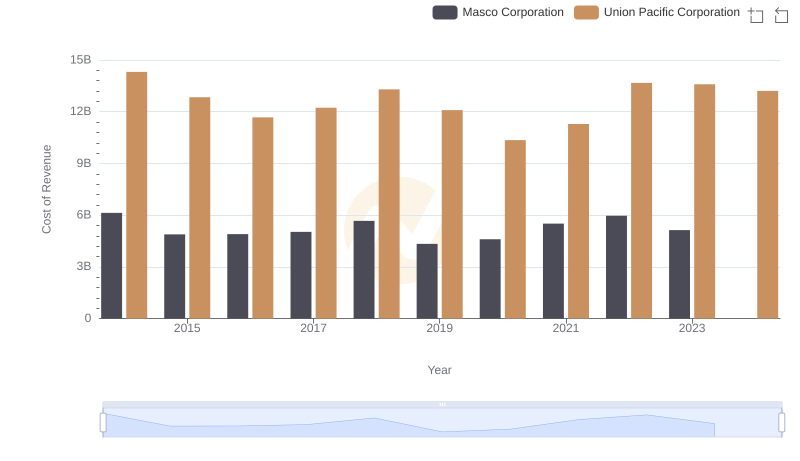
Cost of Revenue Trends: Union Pacific Corporation vs Masco Corporation
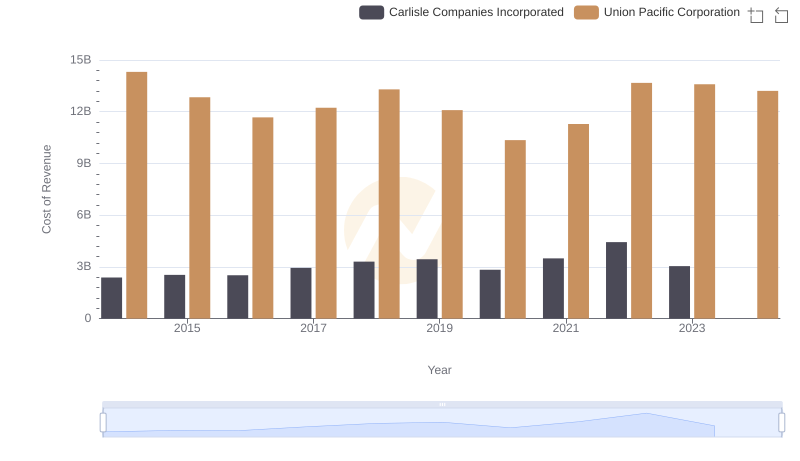
Cost of Revenue Trends: Union Pacific Corporation vs Carlisle Companies Incorporated
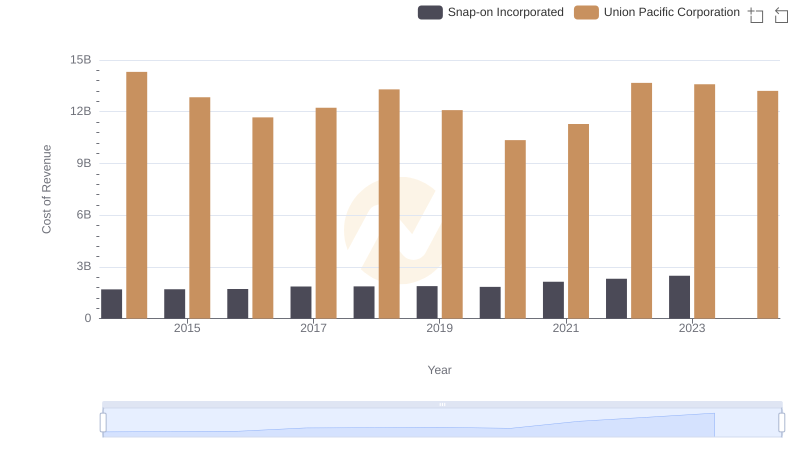
Cost of Revenue Trends: Union Pacific Corporation vs Snap-on Incorporated
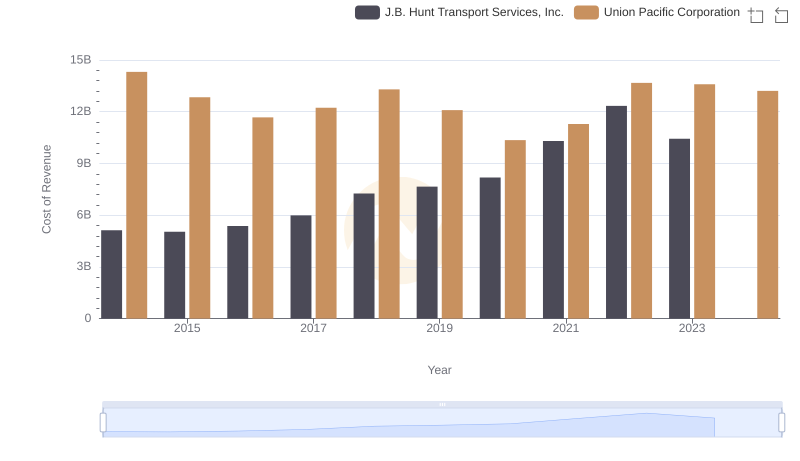
Analyzing Cost of Revenue: Union Pacific Corporation and J.B. Hunt Transport Services, Inc.
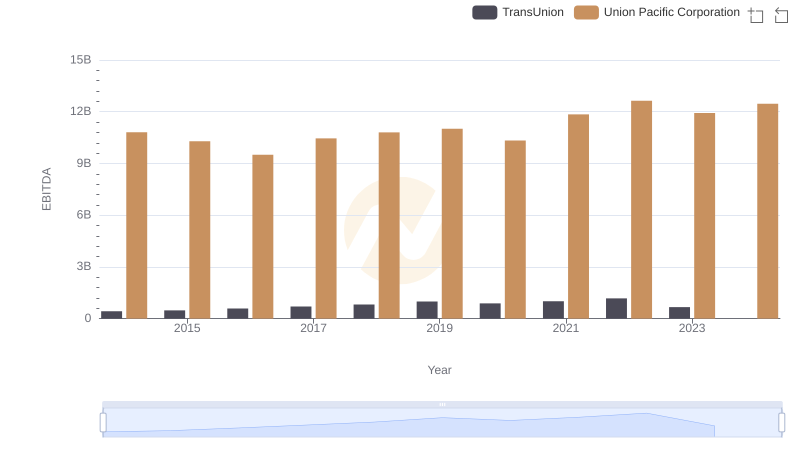
EBITDA Analysis: Evaluating Union Pacific Corporation Against TransUnion