| __timestamp | Ingersoll Rand Inc. | XPO Logistics, Inc. |
|---|---|---|
| Wednesday, January 1, 2014 | 1633224000 | 1975000000 |
| Thursday, January 1, 2015 | 1347800000 | 6538400000 |
| Friday, January 1, 2016 | 1222705000 | 12480100000 |
| Sunday, January 1, 2017 | 1477500000 | 13101100000 |
| Monday, January 1, 2018 | 1677300000 | 14738000000 |
| Tuesday, January 1, 2019 | 1540200000 | 13982000000 |
| Wednesday, January 1, 2020 | 3296800000 | 13689000000 |
| Friday, January 1, 2021 | 3163900000 | 10812000000 |
| Saturday, January 1, 2022 | 3590700000 | 6491000000 |
| Sunday, January 1, 2023 | 3993900000 | 6974000000 |
| Monday, January 1, 2024 | 0 | 7157000000 |
Infusing magic into the data realm
In the ever-evolving landscape of industrial and logistics sectors, Ingersoll Rand Inc. and XPO Logistics, Inc. have showcased intriguing cost of revenue trends over the past decade. From 2014 to 2023, Ingersoll Rand's cost of revenue has seen a steady climb, peaking at nearly $4 billion in 2023, marking a 145% increase from its 2014 figures. Meanwhile, XPO Logistics experienced a more volatile journey, with its cost of revenue reaching a zenith of approximately $14.7 billion in 2018, before tapering to around $7 billion in 2023. This represents a significant 53% reduction from its peak. These trends reflect broader industry shifts, with Ingersoll Rand's consistent growth contrasting sharply with XPO's fluctuating costs, possibly due to strategic realignments or market conditions. As these companies navigate the complexities of their respective industries, their financial trajectories offer valuable insights into operational efficiencies and market dynamics.
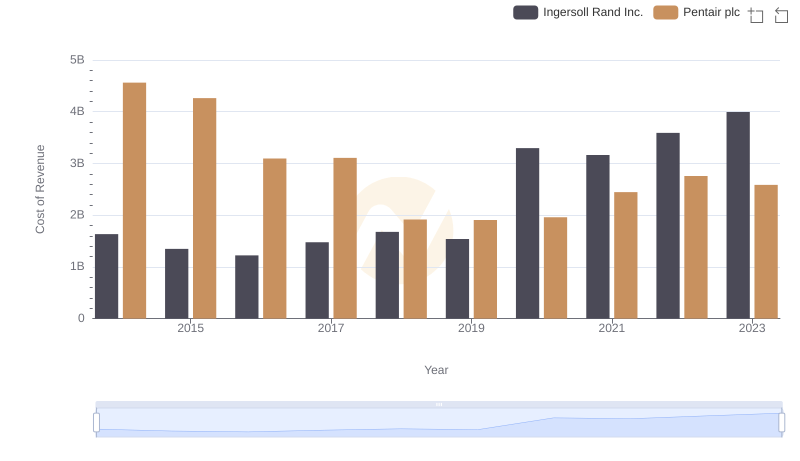
Cost of Revenue: Key Insights for Ingersoll Rand Inc. and Pentair plc
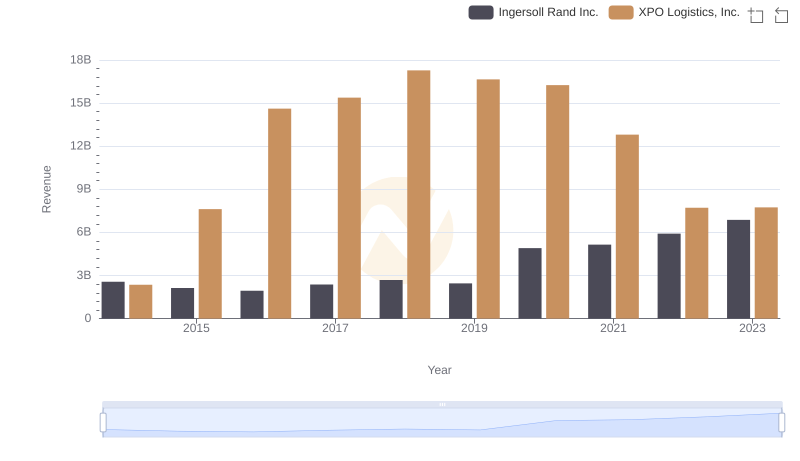
Annual Revenue Comparison: Ingersoll Rand Inc. vs XPO Logistics, Inc.
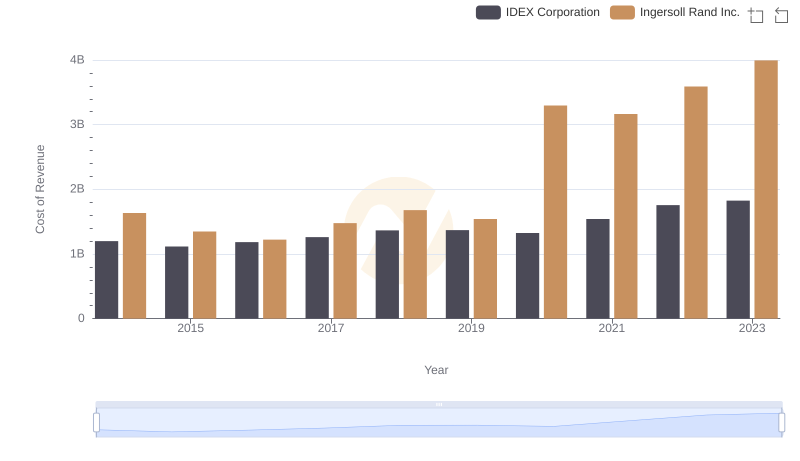
Cost Insights: Breaking Down Ingersoll Rand Inc. and IDEX Corporation's Expenses
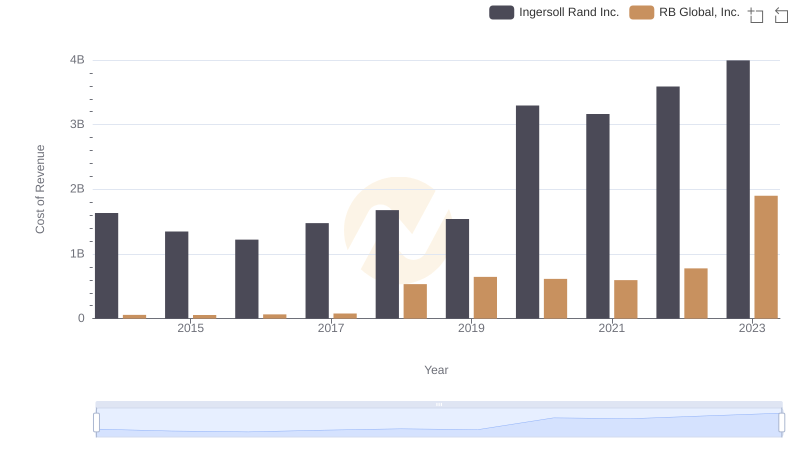
Analyzing Cost of Revenue: Ingersoll Rand Inc. and RB Global, Inc.
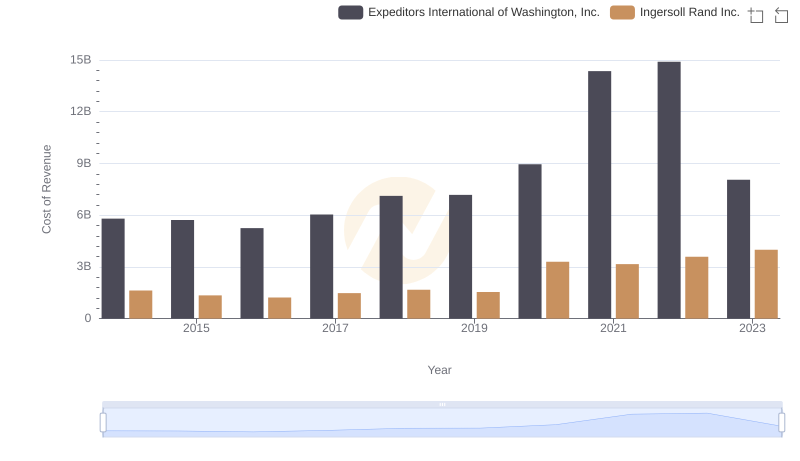
Ingersoll Rand Inc. vs Expeditors International of Washington, Inc.: Efficiency in Cost of Revenue Explored
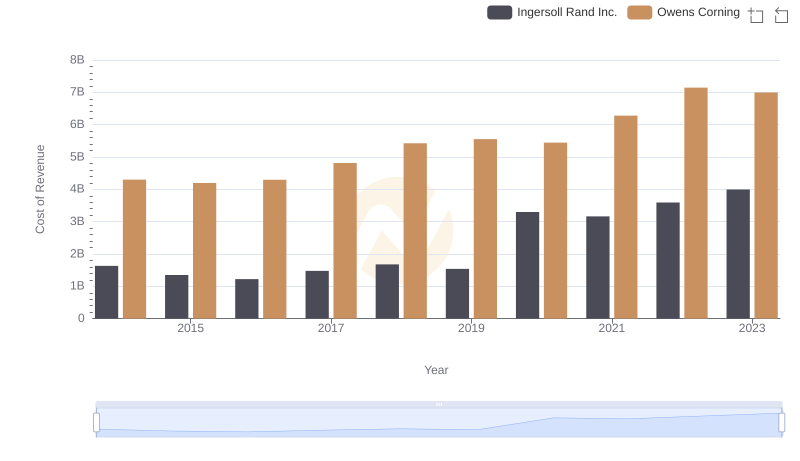
Cost of Revenue: Key Insights for Ingersoll Rand Inc. and Owens Corning
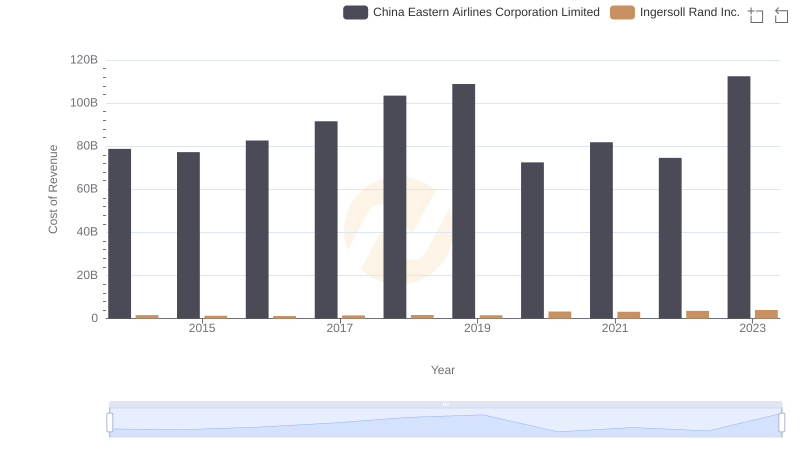
Cost Insights: Breaking Down Ingersoll Rand Inc. and China Eastern Airlines Corporation Limited's Expenses
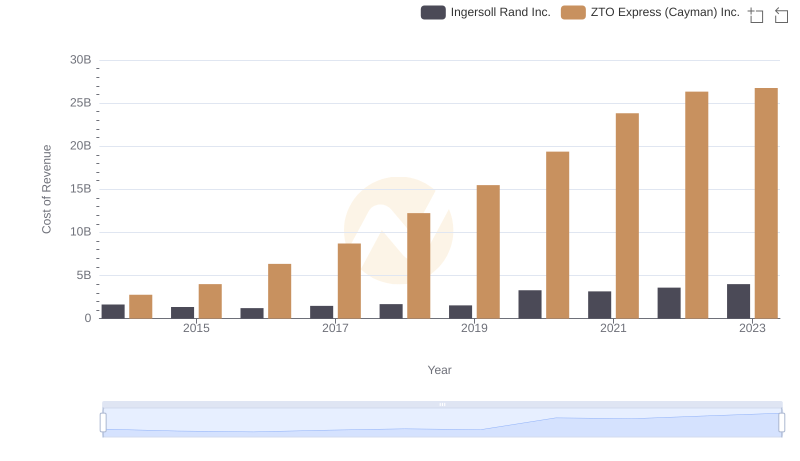
Ingersoll Rand Inc. vs ZTO Express (Cayman) Inc.: Efficiency in Cost of Revenue Explored
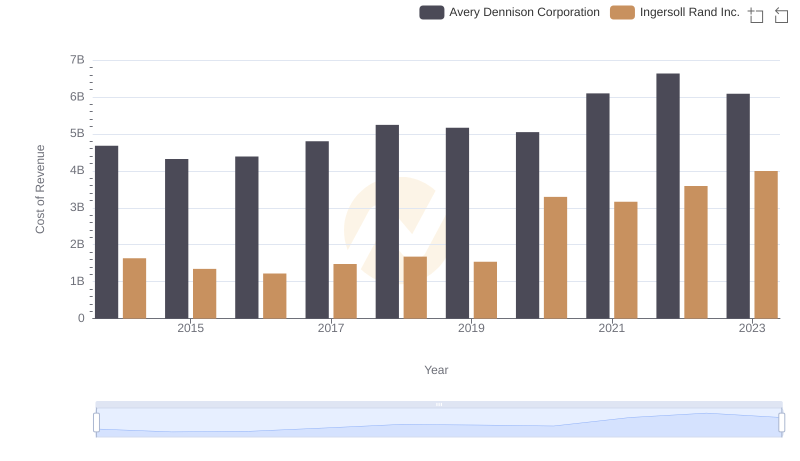
Analyzing Cost of Revenue: Ingersoll Rand Inc. and Avery Dennison Corporation
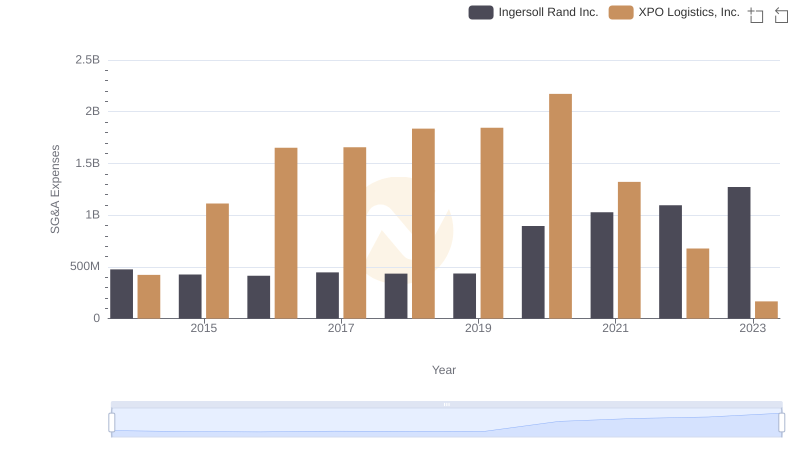
Ingersoll Rand Inc. or XPO Logistics, Inc.: Who Manages SG&A Costs Better?