| __timestamp | Ingersoll Rand Inc. | Pentair plc |
|---|---|---|
| Wednesday, January 1, 2014 | 1633224000 | 4563000000 |
| Thursday, January 1, 2015 | 1347800000 | 4263200000 |
| Friday, January 1, 2016 | 1222705000 | 3095900000 |
| Sunday, January 1, 2017 | 1477500000 | 3107400000 |
| Monday, January 1, 2018 | 1677300000 | 1917400000 |
| Tuesday, January 1, 2019 | 1540200000 | 1905700000 |
| Wednesday, January 1, 2020 | 3296800000 | 1960200000 |
| Friday, January 1, 2021 | 3163900000 | 2445600000 |
| Saturday, January 1, 2022 | 3590700000 | 2757200000 |
| Sunday, January 1, 2023 | 3993900000 | 2585300000 |
| Monday, January 1, 2024 | 0 | 2484000000 |
Cracking the code
In the ever-evolving landscape of industrial manufacturing, understanding cost dynamics is crucial. From 2014 to 2023, Ingersoll Rand Inc. and Pentair plc have shown distinct trends in their cost of revenue. Ingersoll Rand Inc. experienced a significant increase, with costs rising by approximately 145% over the decade. This surge, peaking in 2023, reflects strategic investments and market expansion. Conversely, Pentair plc saw a 43% decline from its 2014 peak, indicating a shift towards efficiency and cost management.
These trends underscore the diverse strategies employed by these industrial giants in navigating market challenges and opportunities.
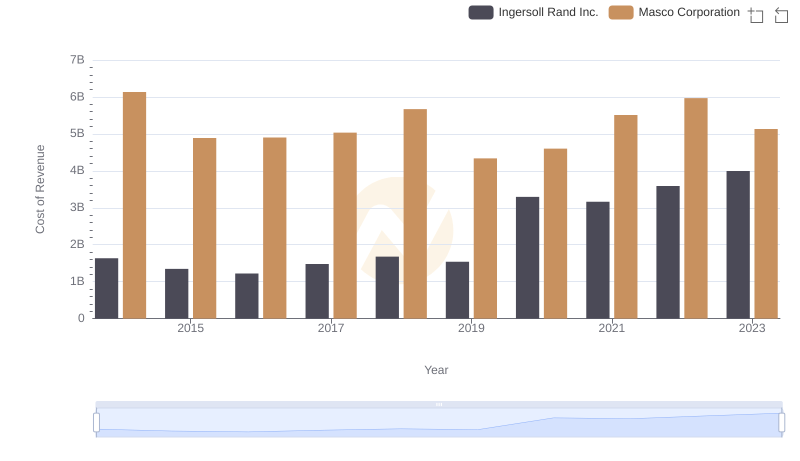
Cost of Revenue: Key Insights for Ingersoll Rand Inc. and Masco Corporation
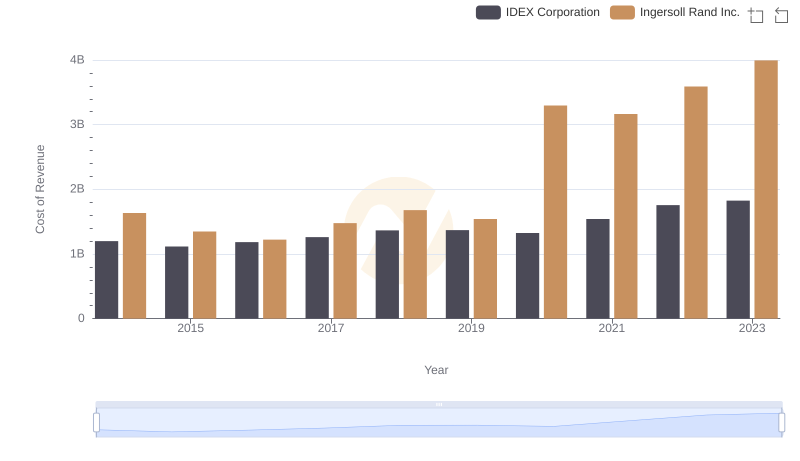
Cost Insights: Breaking Down Ingersoll Rand Inc. and IDEX Corporation's Expenses
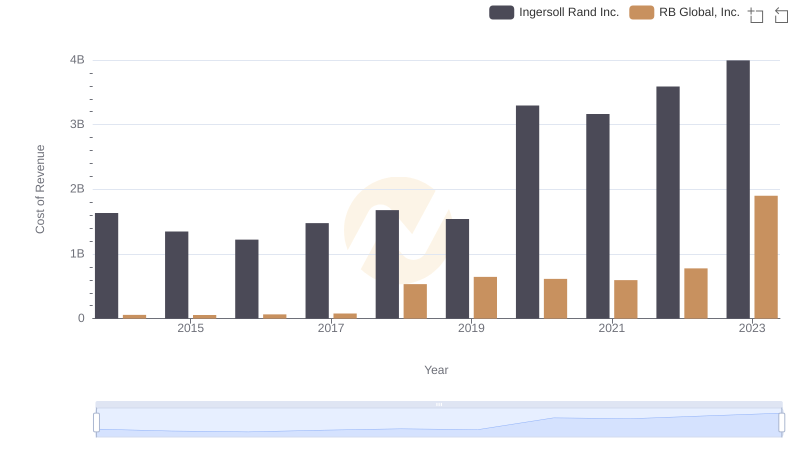
Analyzing Cost of Revenue: Ingersoll Rand Inc. and RB Global, Inc.
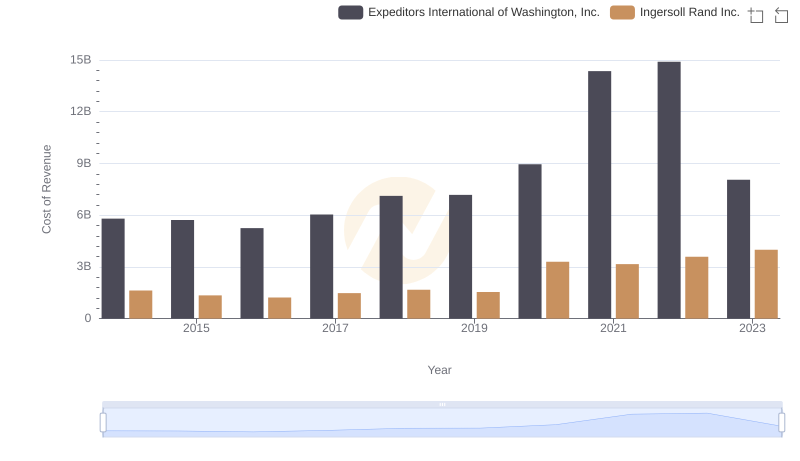
Ingersoll Rand Inc. vs Expeditors International of Washington, Inc.: Efficiency in Cost of Revenue Explored
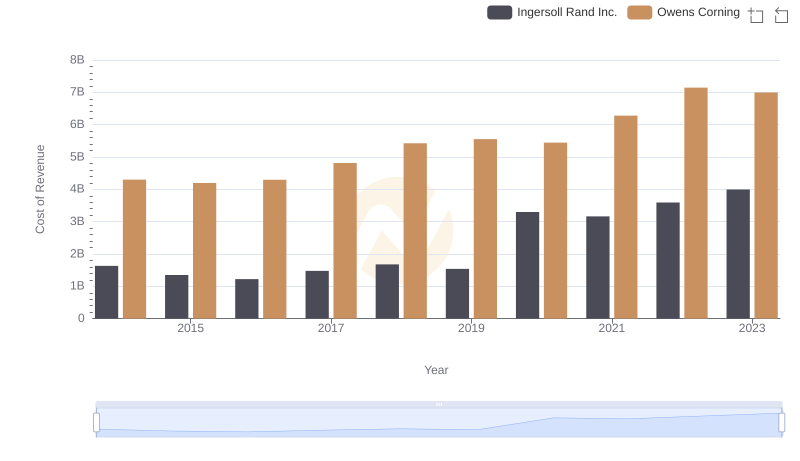
Cost of Revenue: Key Insights for Ingersoll Rand Inc. and Owens Corning
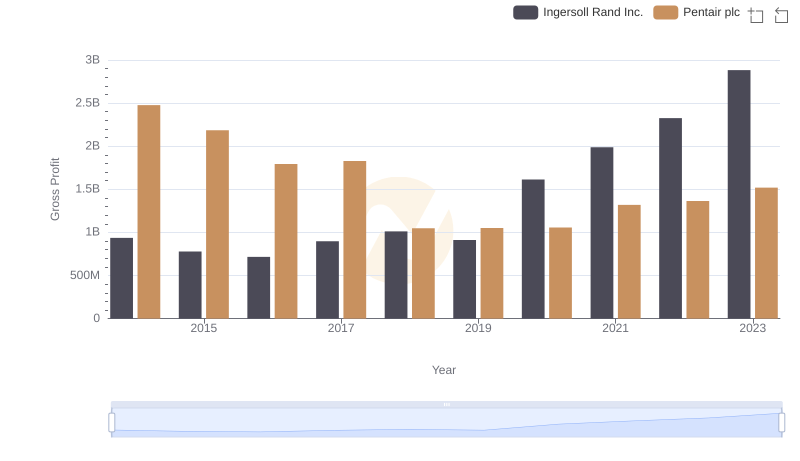
Ingersoll Rand Inc. vs Pentair plc: A Gross Profit Performance Breakdown
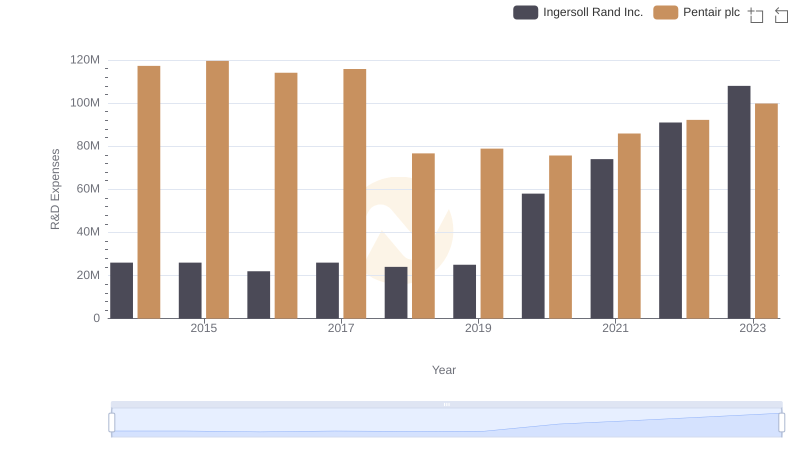
Comparing Innovation Spending: Ingersoll Rand Inc. and Pentair plc
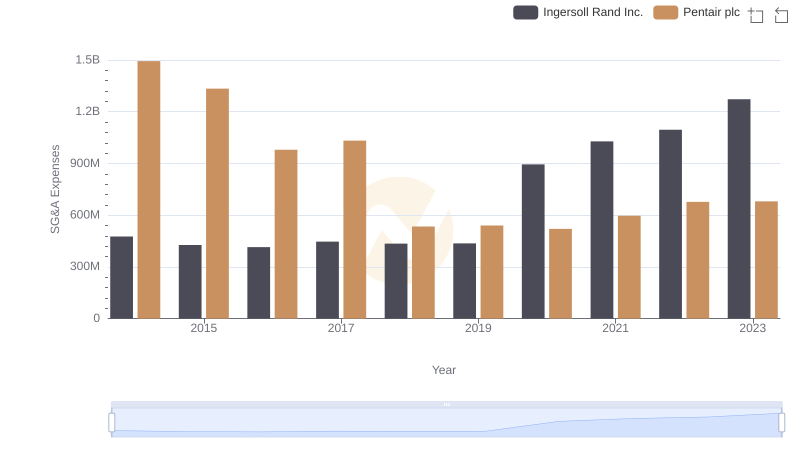
Comparing SG&A Expenses: Ingersoll Rand Inc. vs Pentair plc Trends and Insights