| __timestamp | Ingersoll Rand Inc. | XPO Logistics, Inc. |
|---|---|---|
| Wednesday, January 1, 2014 | 2570005000 | 2356600000 |
| Thursday, January 1, 2015 | 2126900000 | 7623200000 |
| Friday, January 1, 2016 | 1939436000 | 14619400000 |
| Sunday, January 1, 2017 | 2375400000 | 15380800000 |
| Monday, January 1, 2018 | 2689800000 | 17279000000 |
| Tuesday, January 1, 2019 | 2451900000 | 16648000000 |
| Wednesday, January 1, 2020 | 4910200000 | 16252000000 |
| Friday, January 1, 2021 | 5152400000 | 12806000000 |
| Saturday, January 1, 2022 | 5916300000 | 7718000000 |
| Sunday, January 1, 2023 | 6876100000 | 7744000000 |
| Monday, January 1, 2024 | 0 | 8072000000 |
Unlocking the unknown
In the ever-evolving landscape of industrial and logistics sectors, Ingersoll Rand Inc. and XPO Logistics, Inc. have showcased remarkable revenue trajectories over the past decade. From 2014 to 2023, XPO Logistics, Inc. has consistently outperformed Ingersoll Rand Inc. in terms of revenue, peaking in 2018 with a staggering 630% increase from its 2014 figures. However, Ingersoll Rand Inc. has demonstrated a steady growth pattern, achieving a 168% increase in revenue by 2023 compared to 2014.
The year 2020 marked a significant turning point for Ingersoll Rand Inc., with revenues surging by 100% compared to the previous year, reflecting strategic business maneuvers. Meanwhile, XPO Logistics, Inc. experienced a decline post-2018, yet maintained a robust revenue stream, closing 2023 with a 228% increase from its 2014 baseline. This comparison highlights the dynamic nature of these industries and the strategic adaptations of these companies.
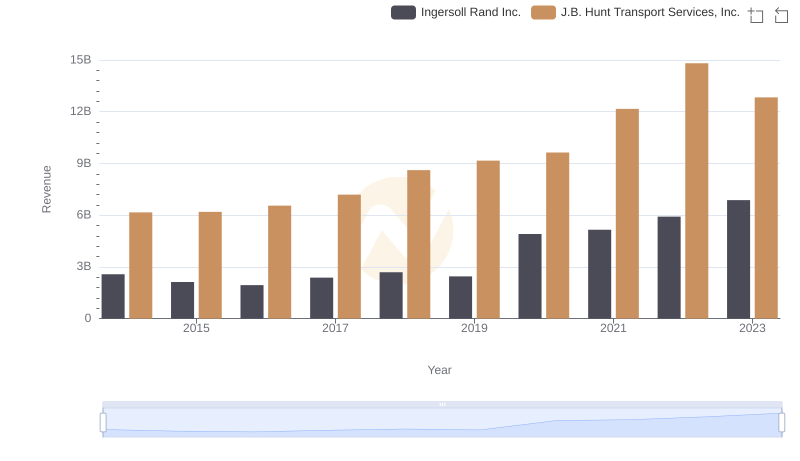
Comparing Revenue Performance: Ingersoll Rand Inc. or J.B. Hunt Transport Services, Inc.?
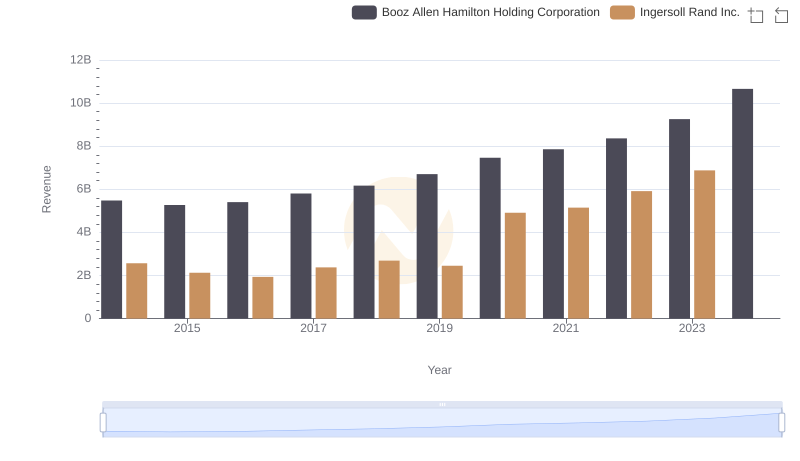
Revenue Insights: Ingersoll Rand Inc. and Booz Allen Hamilton Holding Corporation Performance Compared
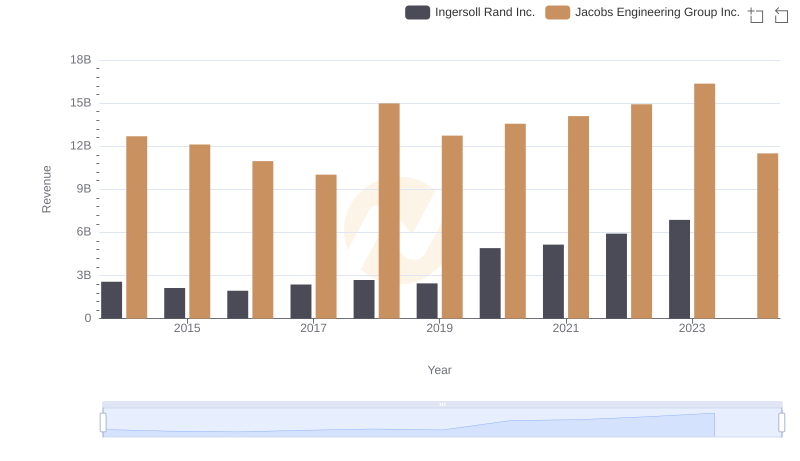
Ingersoll Rand Inc. and Jacobs Engineering Group Inc.: A Comprehensive Revenue Analysis
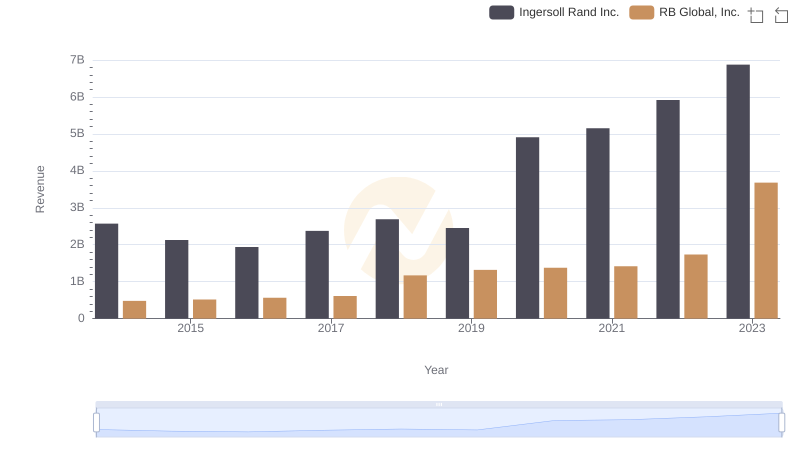
Breaking Down Revenue Trends: Ingersoll Rand Inc. vs RB Global, Inc.
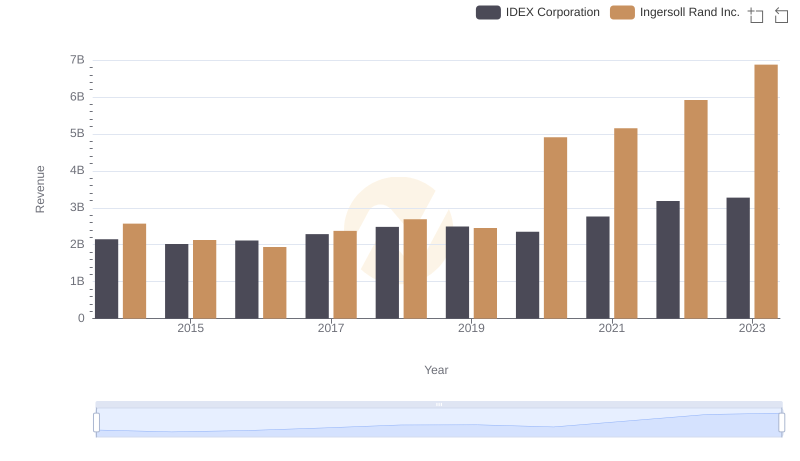
Ingersoll Rand Inc. vs IDEX Corporation: Annual Revenue Growth Compared
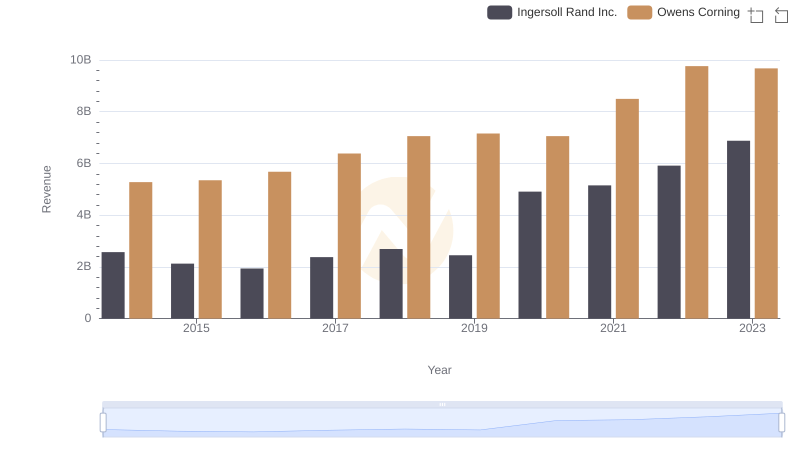
Annual Revenue Comparison: Ingersoll Rand Inc. vs Owens Corning
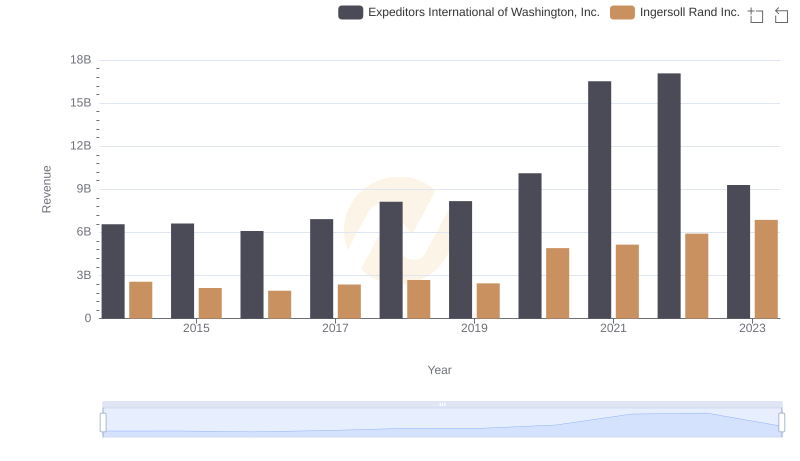
Revenue Insights: Ingersoll Rand Inc. and Expeditors International of Washington, Inc. Performance Compared
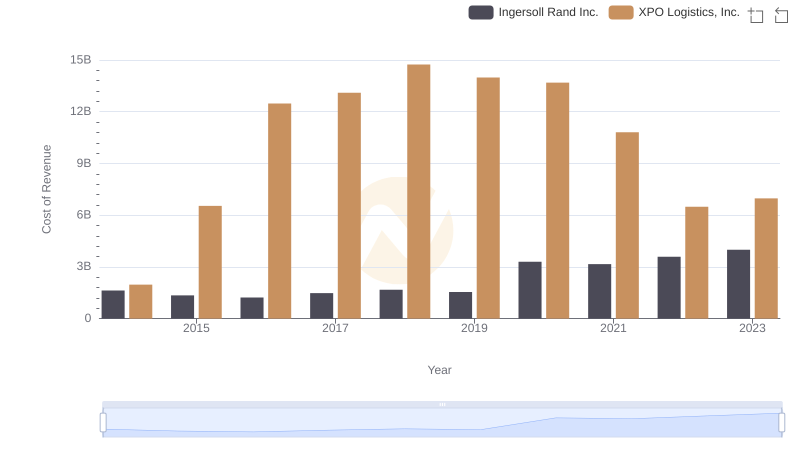
Cost of Revenue Trends: Ingersoll Rand Inc. vs XPO Logistics, Inc.
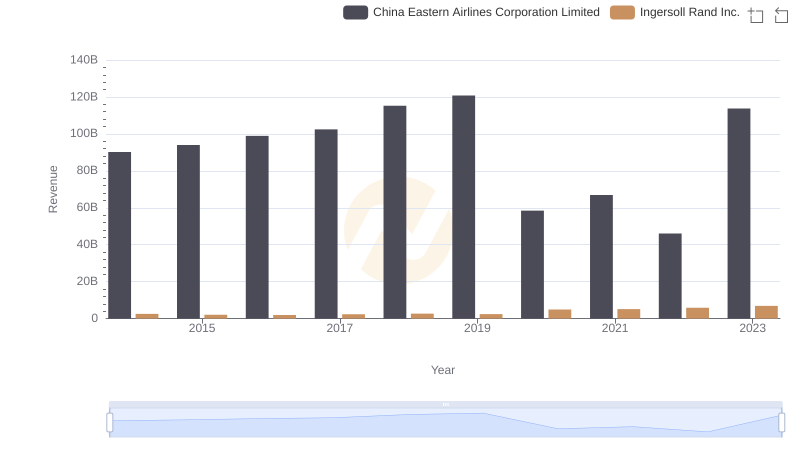
Who Generates More Revenue? Ingersoll Rand Inc. or China Eastern Airlines Corporation Limited
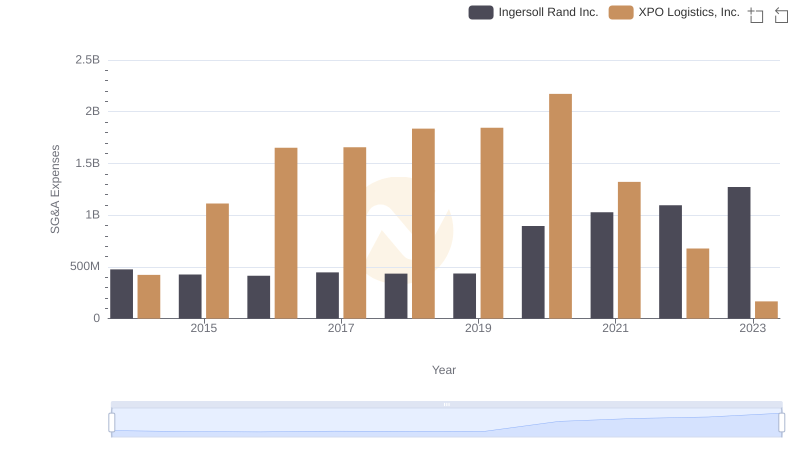
Ingersoll Rand Inc. or XPO Logistics, Inc.: Who Manages SG&A Costs Better?