| __timestamp | Avery Dennison Corporation | Ingersoll Rand Inc. |
|---|---|---|
| Wednesday, January 1, 2014 | 4679100000 | 1633224000 |
| Thursday, January 1, 2015 | 4321100000 | 1347800000 |
| Friday, January 1, 2016 | 4386800000 | 1222705000 |
| Sunday, January 1, 2017 | 4801600000 | 1477500000 |
| Monday, January 1, 2018 | 5243500000 | 1677300000 |
| Tuesday, January 1, 2019 | 5166000000 | 1540200000 |
| Wednesday, January 1, 2020 | 5048200000 | 3296800000 |
| Friday, January 1, 2021 | 6095500000 | 3163900000 |
| Saturday, January 1, 2022 | 6635100000 | 3590700000 |
| Sunday, January 1, 2023 | 6086800000 | 3993900000 |
| Monday, January 1, 2024 | 6225000000 | 0 |
Igniting the spark of knowledge
In the ever-evolving landscape of industrial and materials sectors, Ingersoll Rand Inc. and Avery Dennison Corporation stand as titans. Over the past decade, these companies have showcased intriguing trends in their cost of revenue, a critical metric reflecting the direct costs attributable to the production of goods sold by a company.
From 2014 to 2023, Avery Dennison's cost of revenue surged by approximately 30%, peaking in 2022. This growth underscores the company's expanding operations and market reach. In contrast, Ingersoll Rand experienced a more dramatic increase of over 140% during the same period, highlighting its aggressive expansion and strategic acquisitions.
The year 2020 marked a pivotal point for Ingersoll Rand, with costs nearly doubling, likely due to strategic shifts and market adaptations. As we delve into these financial narratives, the data reveals not just numbers, but stories of resilience, adaptation, and growth.
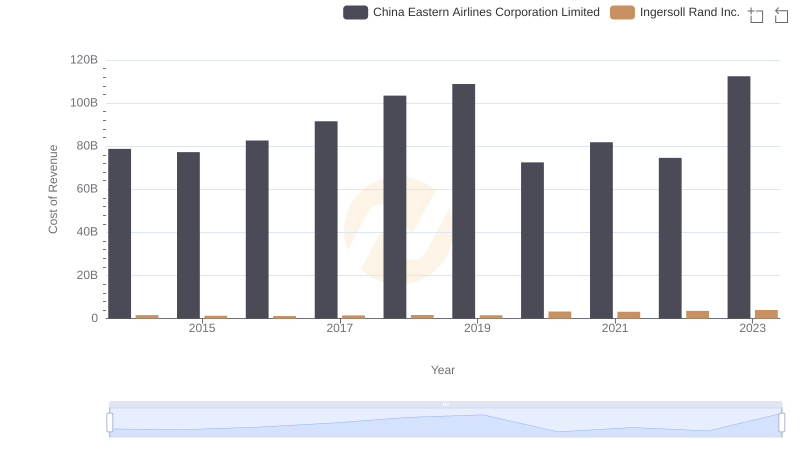
Cost Insights: Breaking Down Ingersoll Rand Inc. and China Eastern Airlines Corporation Limited's Expenses
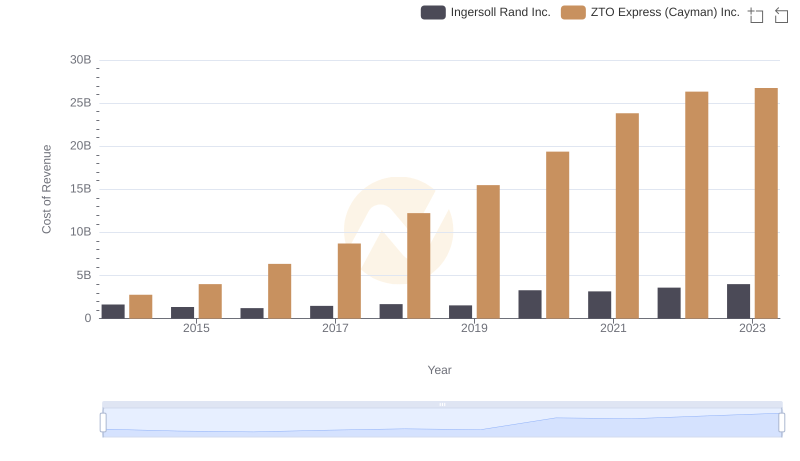
Ingersoll Rand Inc. vs ZTO Express (Cayman) Inc.: Efficiency in Cost of Revenue Explored
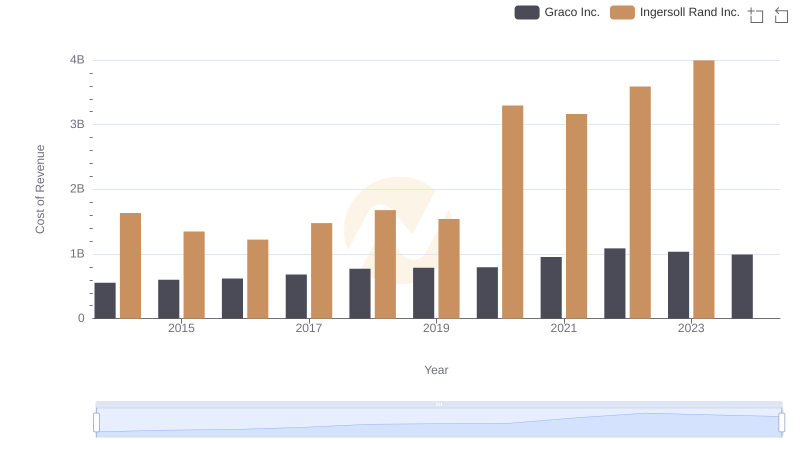
Cost of Revenue Comparison: Ingersoll Rand Inc. vs Graco Inc.
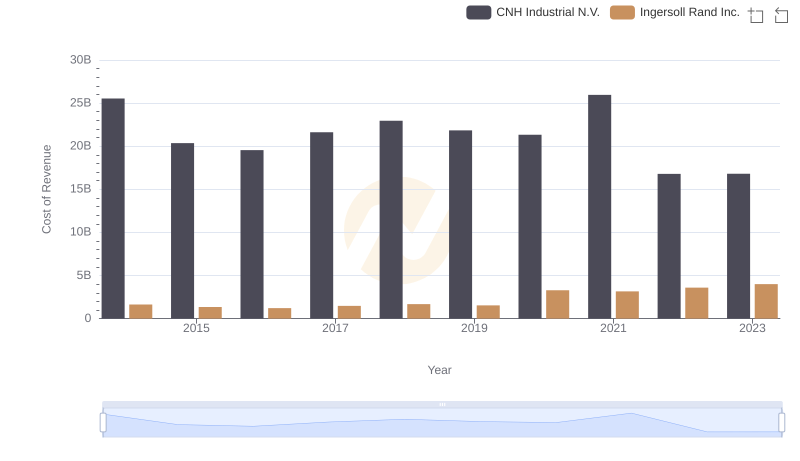
Cost of Revenue Trends: Ingersoll Rand Inc. vs CNH Industrial N.V.
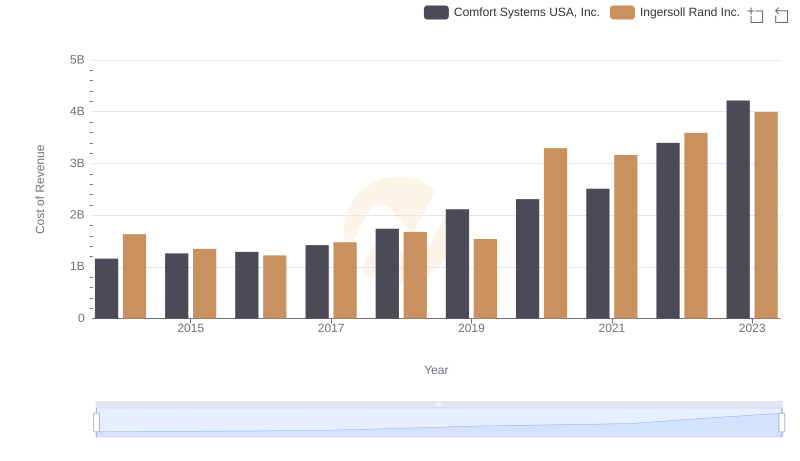
Analyzing Cost of Revenue: Ingersoll Rand Inc. and Comfort Systems USA, Inc.
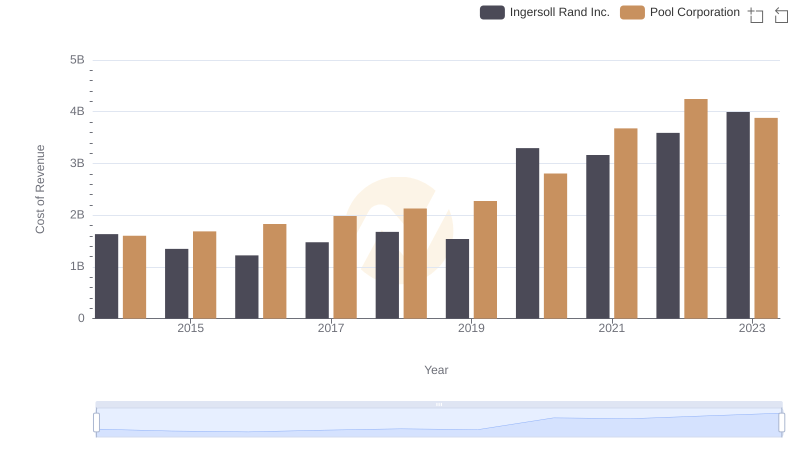
Cost Insights: Breaking Down Ingersoll Rand Inc. and Pool Corporation's Expenses
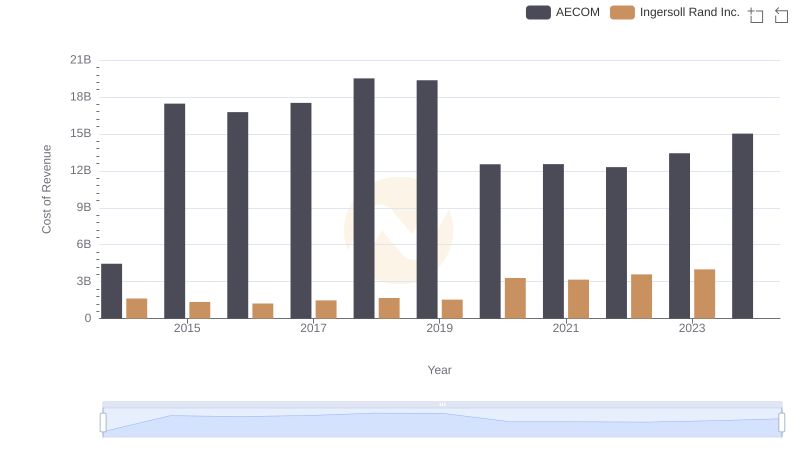
Cost Insights: Breaking Down Ingersoll Rand Inc. and AECOM's Expenses
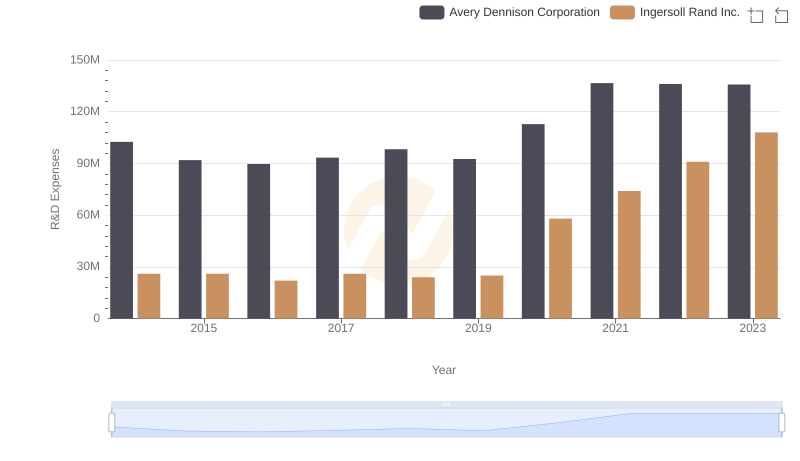
Research and Development Investment: Ingersoll Rand Inc. vs Avery Dennison Corporation
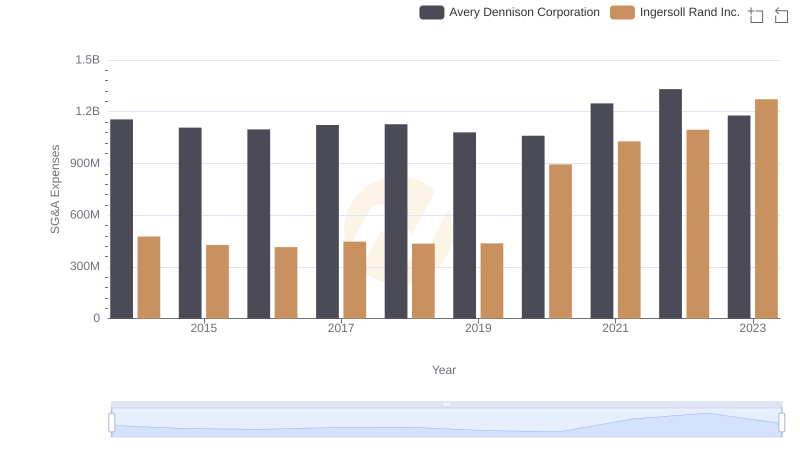
Operational Costs Compared: SG&A Analysis of Ingersoll Rand Inc. and Avery Dennison Corporation