| __timestamp | Ingersoll Rand Inc. | Owens Corning |
|---|---|---|
| Wednesday, January 1, 2014 | 1633224000 | 4300000000 |
| Thursday, January 1, 2015 | 1347800000 | 4197000000 |
| Friday, January 1, 2016 | 1222705000 | 4296000000 |
| Sunday, January 1, 2017 | 1477500000 | 4812000000 |
| Monday, January 1, 2018 | 1677300000 | 5425000000 |
| Tuesday, January 1, 2019 | 1540200000 | 5551000000 |
| Wednesday, January 1, 2020 | 3296800000 | 5445000000 |
| Friday, January 1, 2021 | 3163900000 | 6281000000 |
| Saturday, January 1, 2022 | 3590700000 | 7145000000 |
| Sunday, January 1, 2023 | 3993900000 | 6994000000 |
| Monday, January 1, 2024 | 0 |
Infusing magic into the data realm
In the ever-evolving landscape of industrial manufacturing, understanding cost dynamics is crucial. From 2014 to 2023, Ingersoll Rand Inc. and Owens Corning have shown distinct trajectories in their cost of revenue. Ingersoll Rand Inc. experienced a significant surge, with costs nearly tripling from 2014 to 2023, peaking at approximately $4 billion. This reflects a strategic expansion and increased operational scale. Meanwhile, Owens Corning's cost of revenue grew by about 63%, reaching around $7 billion in 2022, before slightly declining in 2023. This indicates a robust yet more stable growth pattern. The data highlights how both companies navigated economic shifts, with Ingersoll Rand Inc. showing more aggressive cost increases, possibly due to acquisitions or scaling operations, while Owens Corning maintained a steadier growth path. These insights are pivotal for investors and analysts monitoring industrial sector trends.
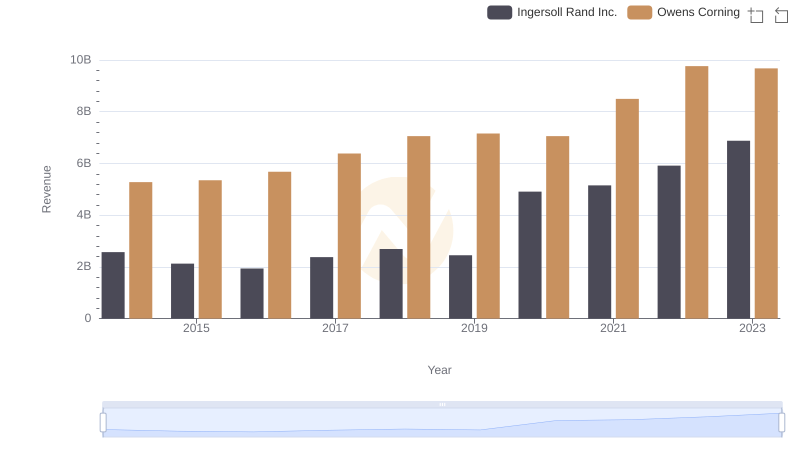
Annual Revenue Comparison: Ingersoll Rand Inc. vs Owens Corning
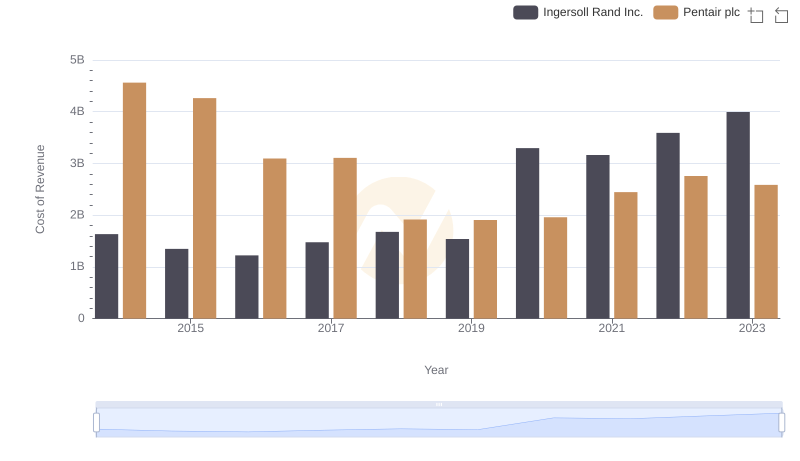
Cost of Revenue: Key Insights for Ingersoll Rand Inc. and Pentair plc
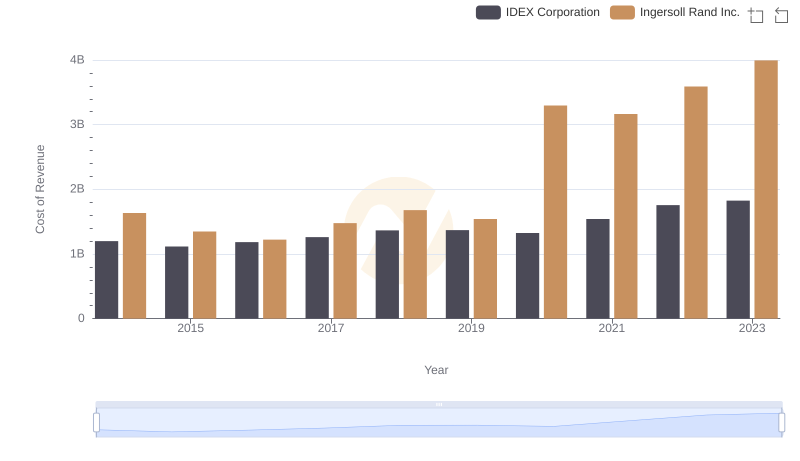
Cost Insights: Breaking Down Ingersoll Rand Inc. and IDEX Corporation's Expenses
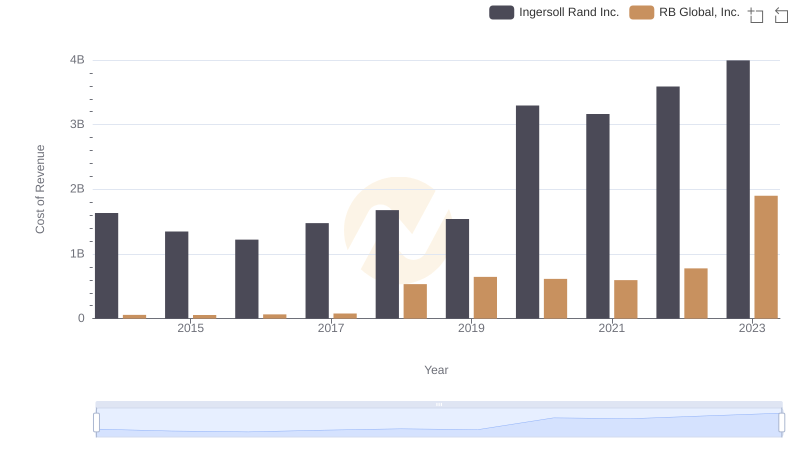
Analyzing Cost of Revenue: Ingersoll Rand Inc. and RB Global, Inc.
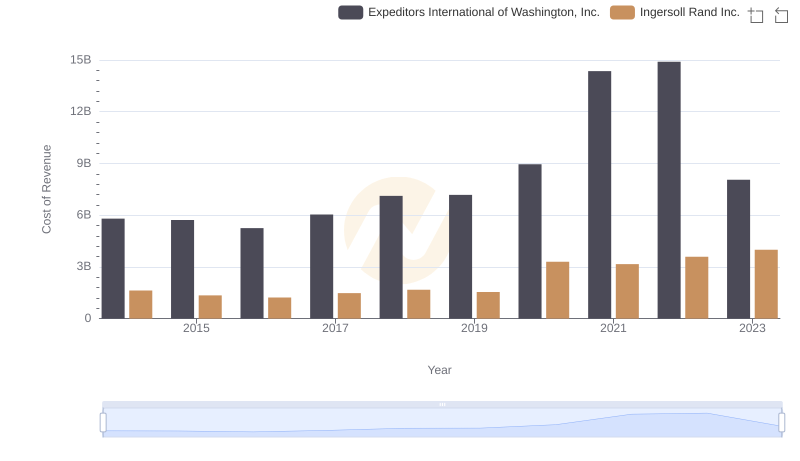
Ingersoll Rand Inc. vs Expeditors International of Washington, Inc.: Efficiency in Cost of Revenue Explored
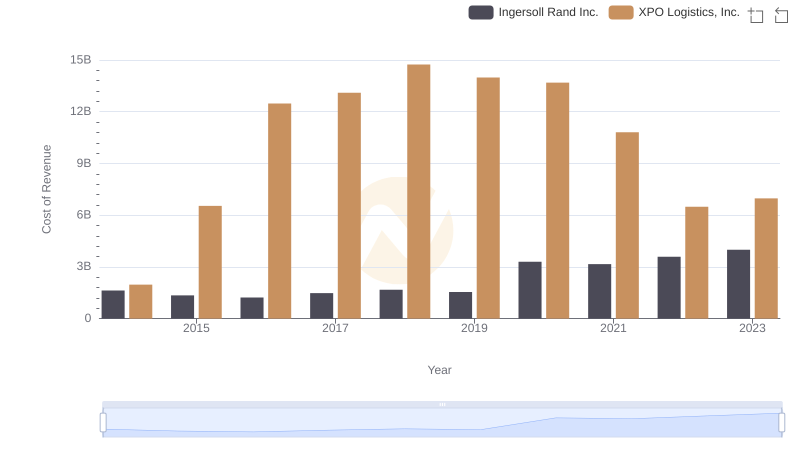
Cost of Revenue Trends: Ingersoll Rand Inc. vs XPO Logistics, Inc.
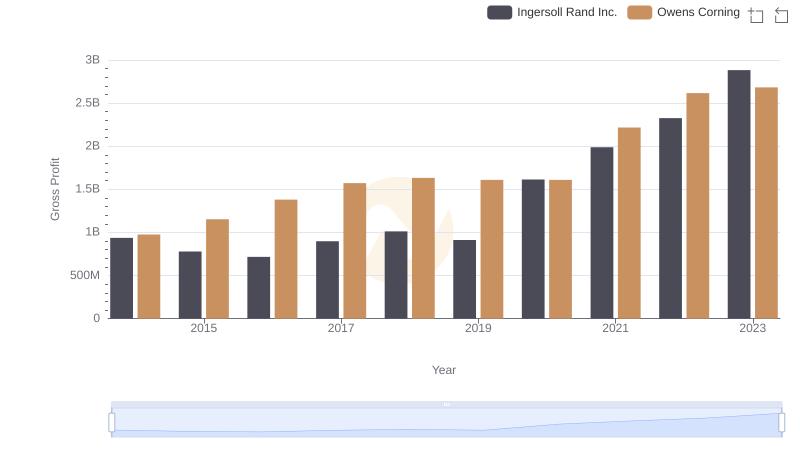
Who Generates Higher Gross Profit? Ingersoll Rand Inc. or Owens Corning
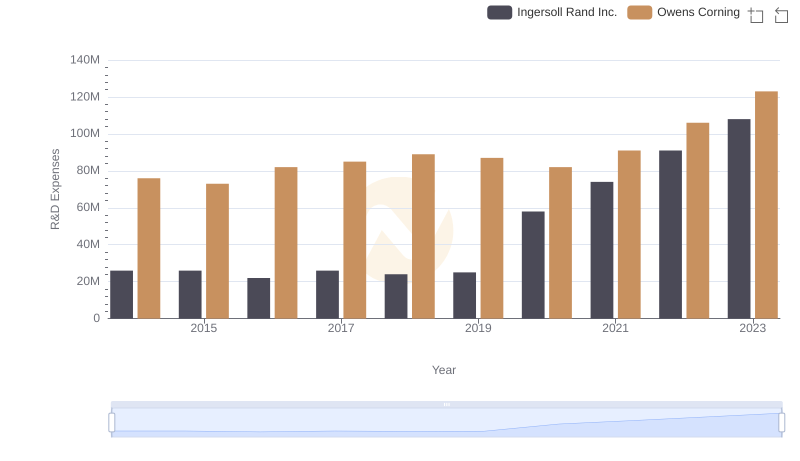
R&D Insights: How Ingersoll Rand Inc. and Owens Corning Allocate Funds
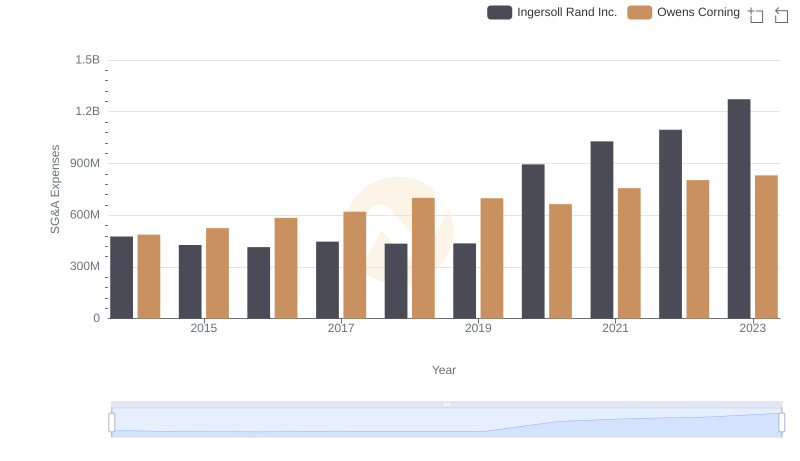
Ingersoll Rand Inc. and Owens Corning: SG&A Spending Patterns Compared