| __timestamp | Cisco Systems, Inc. | TE Connectivity Ltd. |
|---|---|---|
| Wednesday, January 1, 2014 | 47142000000 | 13912000000 |
| Thursday, January 1, 2015 | 49161000000 | 12233000000 |
| Friday, January 1, 2016 | 49247000000 | 12238000000 |
| Sunday, January 1, 2017 | 48005000000 | 13113000000 |
| Monday, January 1, 2018 | 49330000000 | 13988000000 |
| Tuesday, January 1, 2019 | 51904000000 | 13448000000 |
| Wednesday, January 1, 2020 | 49301000000 | 12172000000 |
| Friday, January 1, 2021 | 49818000000 | 14923000000 |
| Saturday, January 1, 2022 | 51557000000 | 16281000000 |
| Sunday, January 1, 2023 | 56998000000 | 16034000000 |
| Monday, January 1, 2024 | 53803000000 | 15845000000 |
Unleashing the power of data
In the ever-evolving tech landscape, Cisco Systems, Inc. and TE Connectivity Ltd. have showcased intriguing revenue trajectories over the past decade. From 2014 to 2023, Cisco's revenue surged by approximately 21%, peaking in 2023 with a notable 57 billion USD. This growth reflects Cisco's strategic innovations and market adaptability. Meanwhile, TE Connectivity experienced a steady climb, with a 15% increase, reaching its zenith in 2022 at 16 billion USD. This upward trend underscores TE's resilience and expansion in the connectivity sector. The data reveals a compelling narrative of two industry giants navigating through technological advancements and market challenges. As we look to 2024, both companies continue to demonstrate robust financial health, albeit with slight fluctuations. This analysis not only highlights their financial prowess but also sets the stage for future market dynamics.
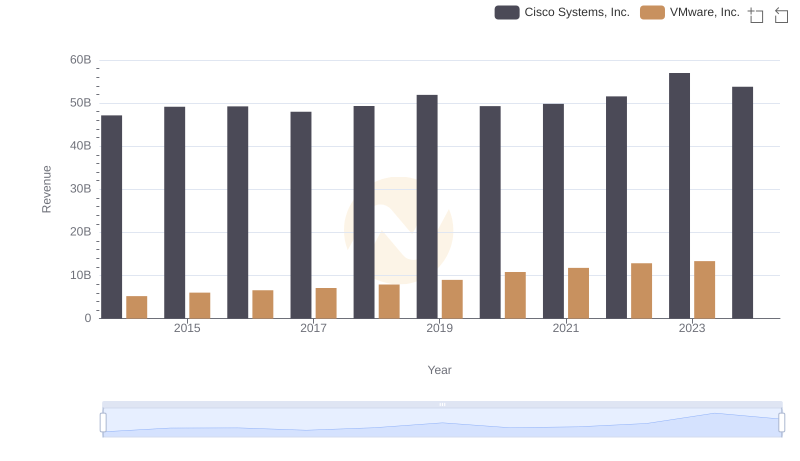
Annual Revenue Comparison: Cisco Systems, Inc. vs VMware, Inc.
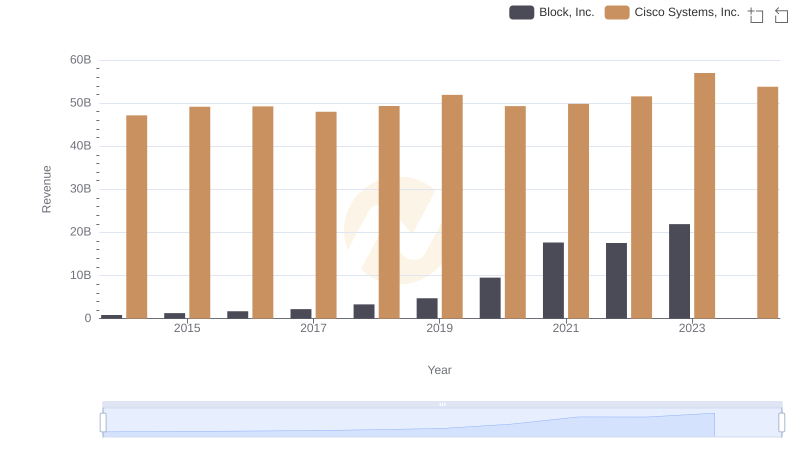
Revenue Insights: Cisco Systems, Inc. and Block, Inc. Performance Compared
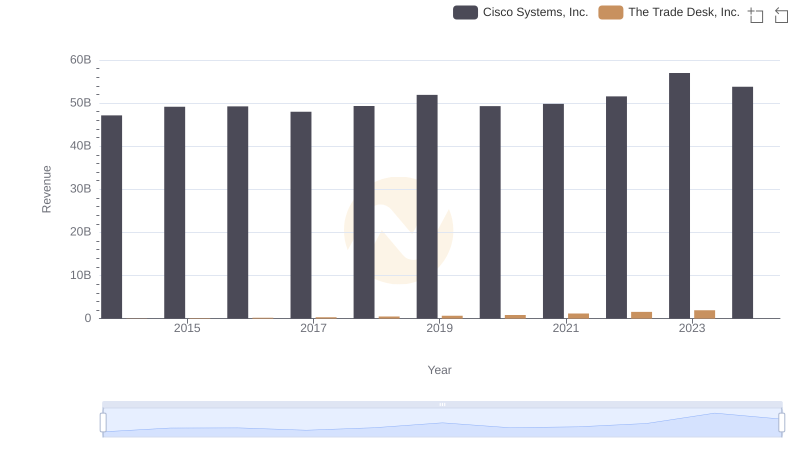
Cisco Systems, Inc. or The Trade Desk, Inc.: Who Leads in Yearly Revenue?
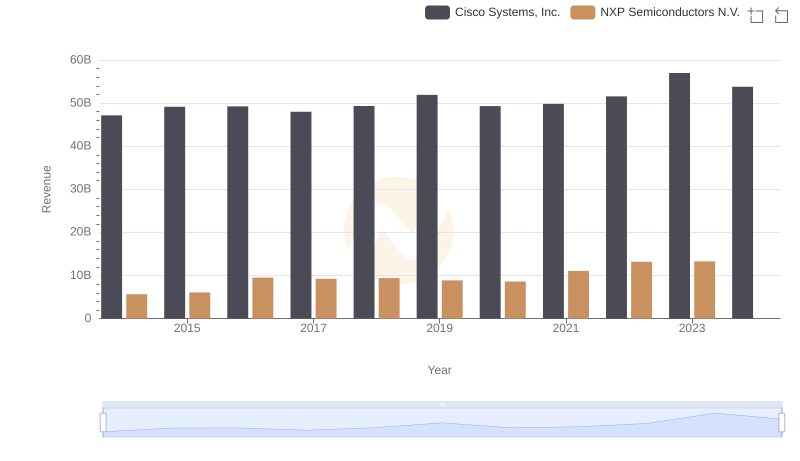
Cisco Systems, Inc. and NXP Semiconductors N.V.: A Comprehensive Revenue Analysis
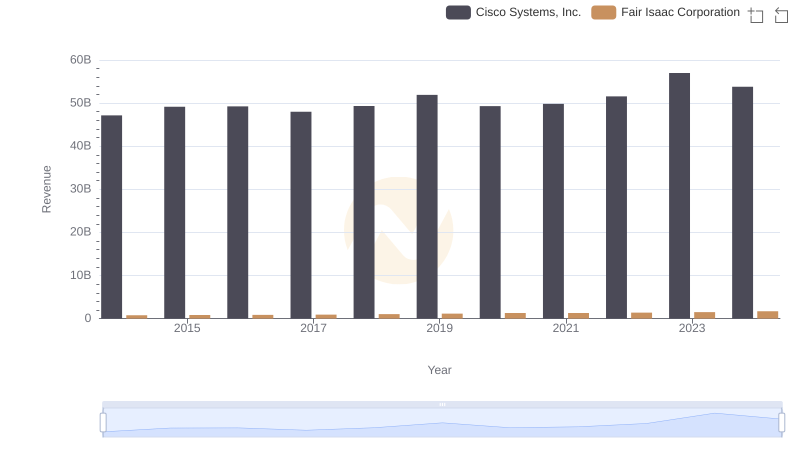
Annual Revenue Comparison: Cisco Systems, Inc. vs Fair Isaac Corporation
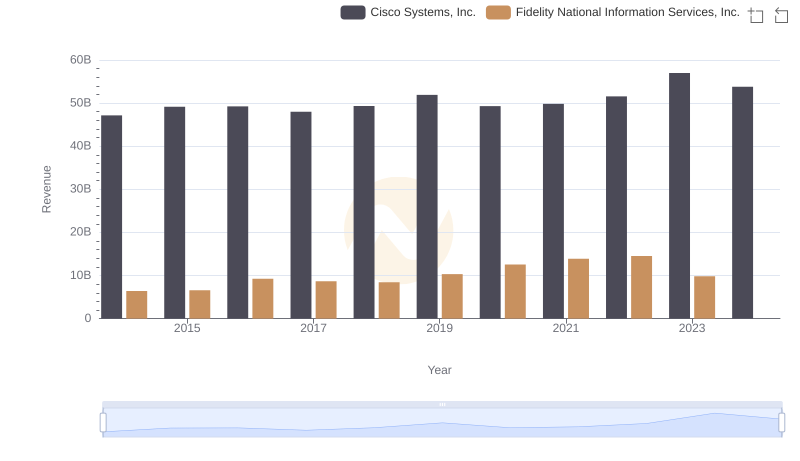
Cisco Systems, Inc. or Fidelity National Information Services, Inc.: Who Leads in Yearly Revenue?
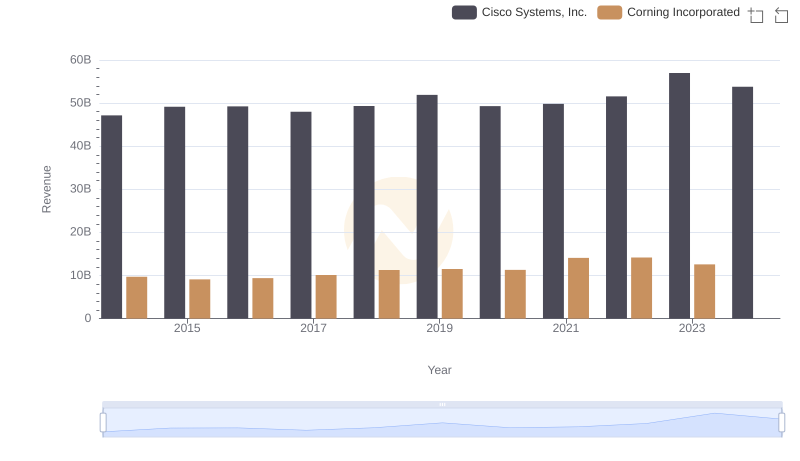
Annual Revenue Comparison: Cisco Systems, Inc. vs Corning Incorporated
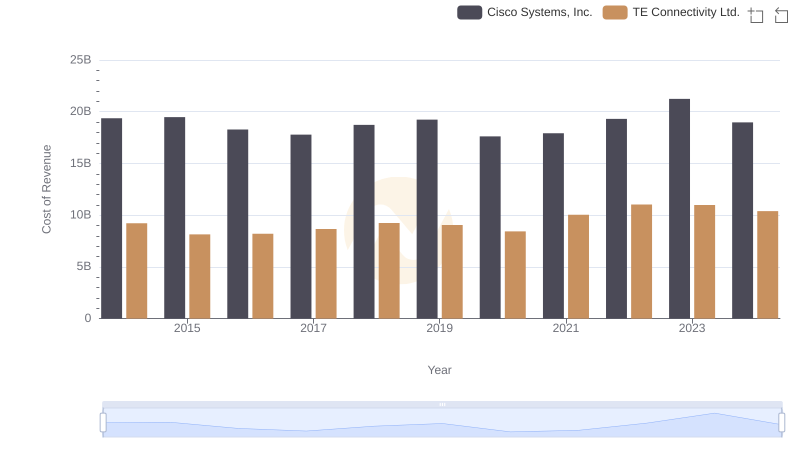
Cost of Revenue Trends: Cisco Systems, Inc. vs TE Connectivity Ltd.
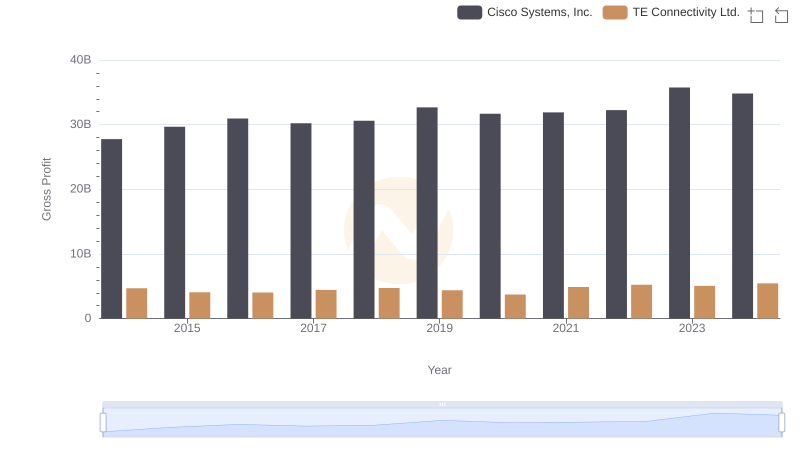
Who Generates Higher Gross Profit? Cisco Systems, Inc. or TE Connectivity Ltd.
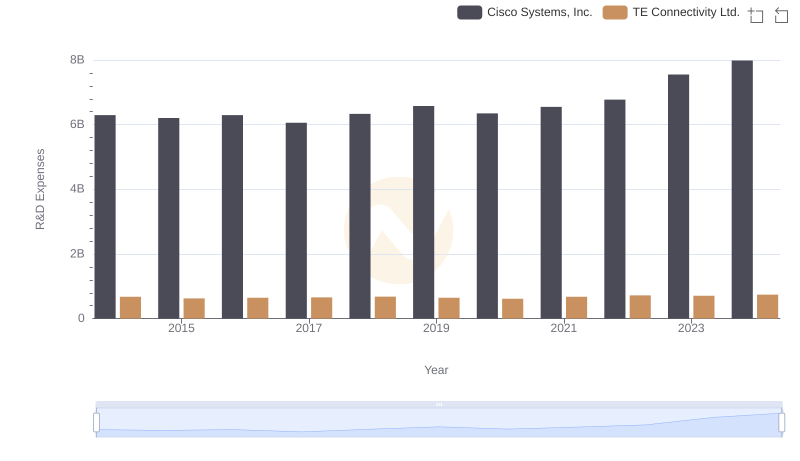
Cisco Systems, Inc. vs TE Connectivity Ltd.: Strategic Focus on R&D Spending
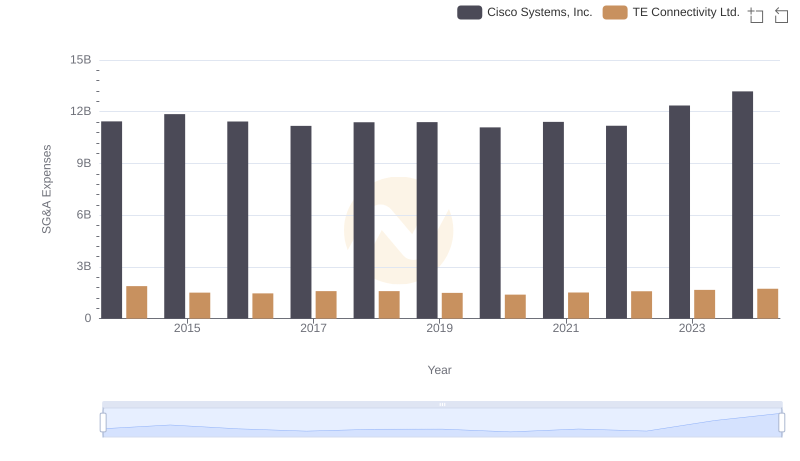
Who Optimizes SG&A Costs Better? Cisco Systems, Inc. or TE Connectivity Ltd.
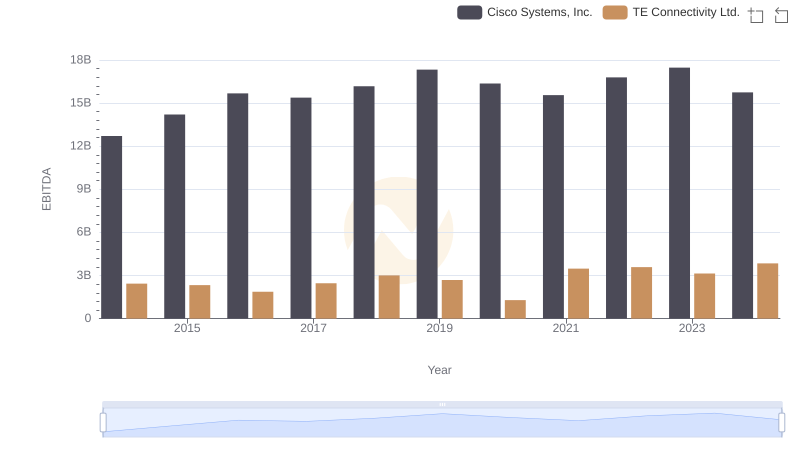
Professional EBITDA Benchmarking: Cisco Systems, Inc. vs TE Connectivity Ltd.