| __timestamp | Cisco Systems, Inc. | Electronic Arts Inc. |
|---|---|---|
| Wednesday, January 1, 2014 | 19373000000 | 1347000000 |
| Thursday, January 1, 2015 | 19480000000 | 1429000000 |
| Friday, January 1, 2016 | 18287000000 | 1354000000 |
| Sunday, January 1, 2017 | 17781000000 | 1298000000 |
| Monday, January 1, 2018 | 18724000000 | 1277000000 |
| Tuesday, January 1, 2019 | 19238000000 | 1322000000 |
| Wednesday, January 1, 2020 | 17618000000 | 1369000000 |
| Friday, January 1, 2021 | 17924000000 | 1494000000 |
| Saturday, January 1, 2022 | 19309000000 | 1859000000 |
| Sunday, January 1, 2023 | 21245000000 | 1792000000 |
| Monday, January 1, 2024 | 18975000000 | 1710000000 |
Unlocking the unknown
In the ever-evolving landscape of technology and entertainment, understanding cost structures is crucial. Cisco Systems, Inc., a leader in networking technology, and Electronic Arts Inc., a giant in the gaming industry, have shown intriguing trends in their cost of revenue from 2014 to 2024.
Cisco's cost of revenue has seen a modest decline of about 2% from 2014 to 2020, followed by a significant increase of approximately 20% by 2023, reflecting strategic investments and market expansion. In contrast, Electronic Arts experienced a steady rise, with a notable 38% increase from 2014 to 2023, highlighting its growing market share and investment in game development.
These trends underscore the dynamic nature of these industries, where cost management and strategic investments play pivotal roles in sustaining growth and competitiveness.
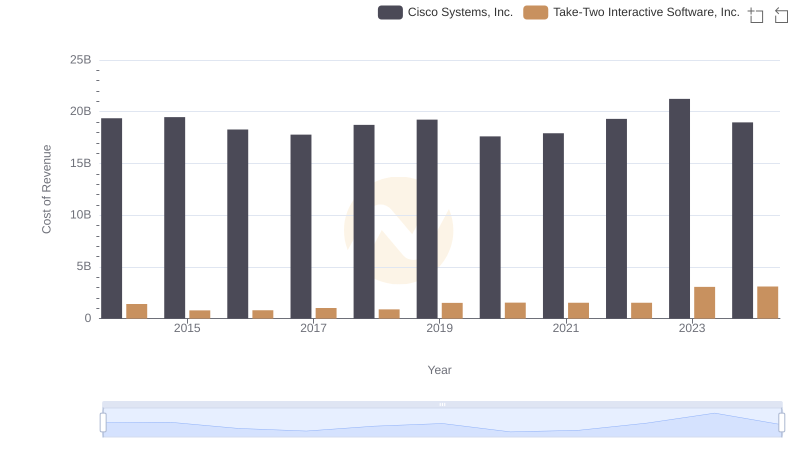
Cisco Systems, Inc. vs Take-Two Interactive Software, Inc.: Efficiency in Cost of Revenue Explored
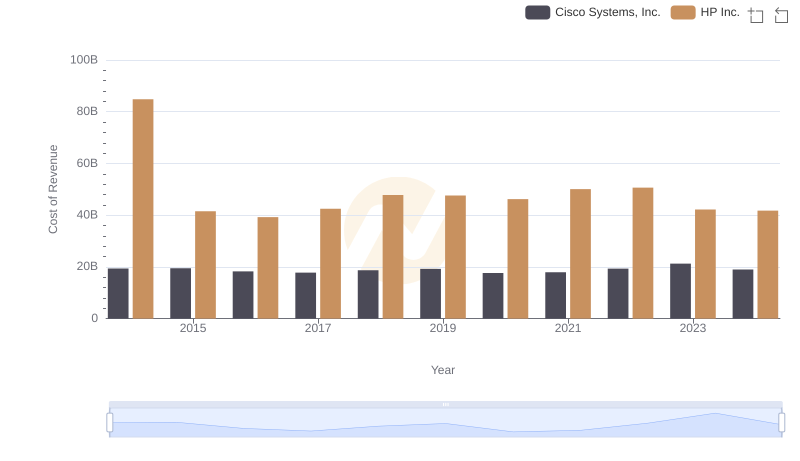
Cost of Revenue: Key Insights for Cisco Systems, Inc. and HP Inc.
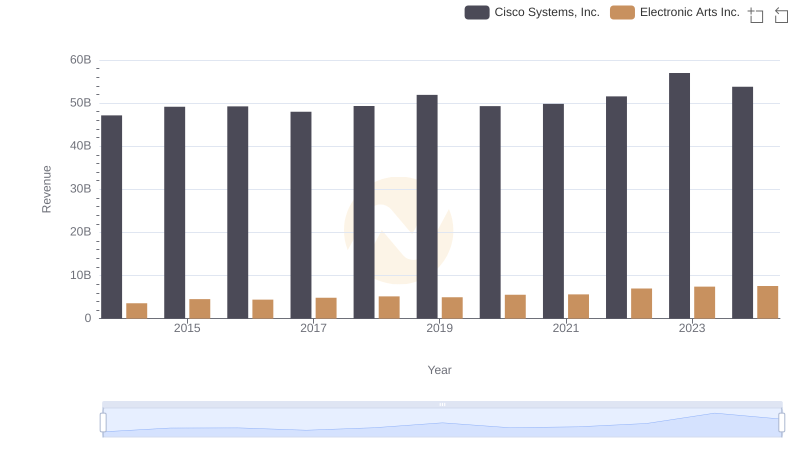
Cisco Systems, Inc. or Electronic Arts Inc.: Who Leads in Yearly Revenue?

Analyzing Cost of Revenue: Cisco Systems, Inc. and Microchip Technology Incorporated
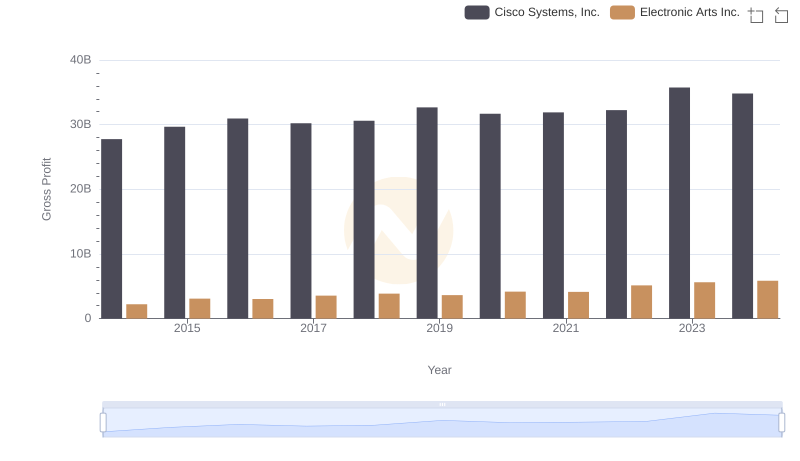
Gross Profit Trends Compared: Cisco Systems, Inc. vs Electronic Arts Inc.
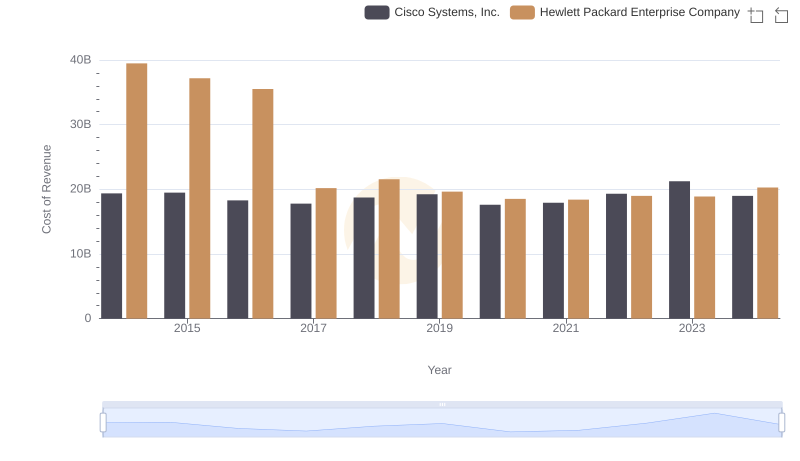
Cost of Revenue Comparison: Cisco Systems, Inc. vs Hewlett Packard Enterprise Company
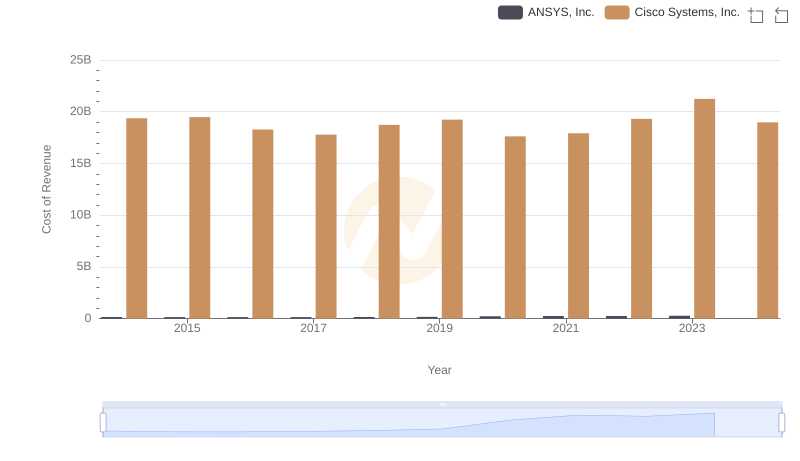
Cost of Revenue Trends: Cisco Systems, Inc. vs ANSYS, Inc.
Cost Insights: Breaking Down Cisco Systems, Inc. and II-VI Incorporated's Expenses
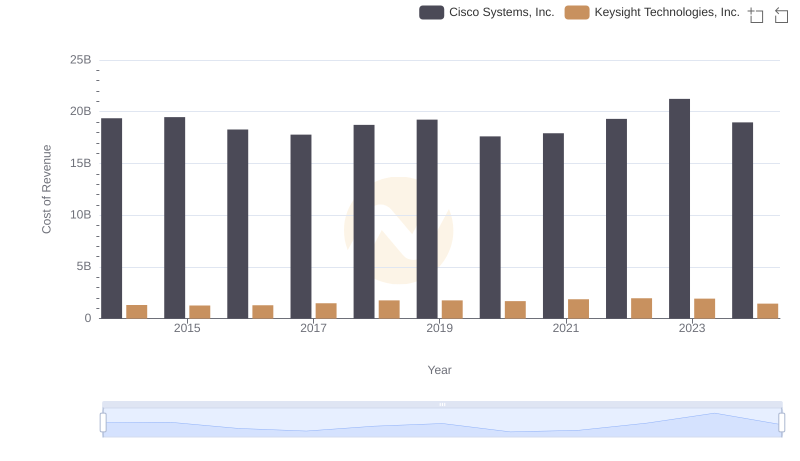
Cisco Systems, Inc. vs Keysight Technologies, Inc.: Efficiency in Cost of Revenue Explored
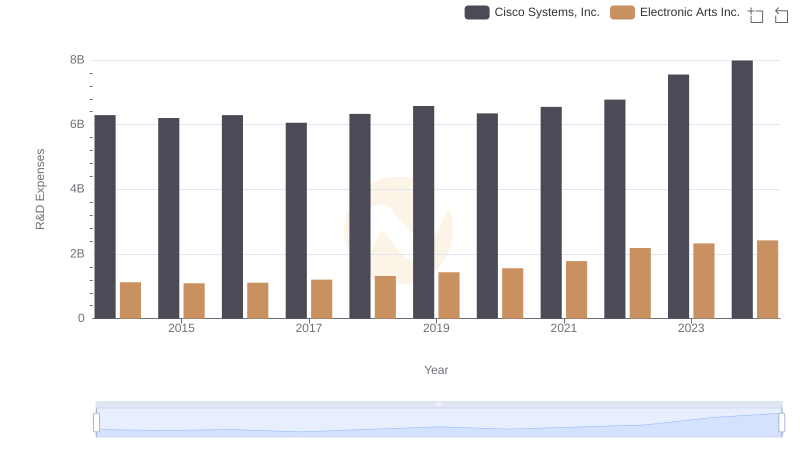
Who Prioritizes Innovation? R&D Spending Compared for Cisco Systems, Inc. and Electronic Arts Inc.
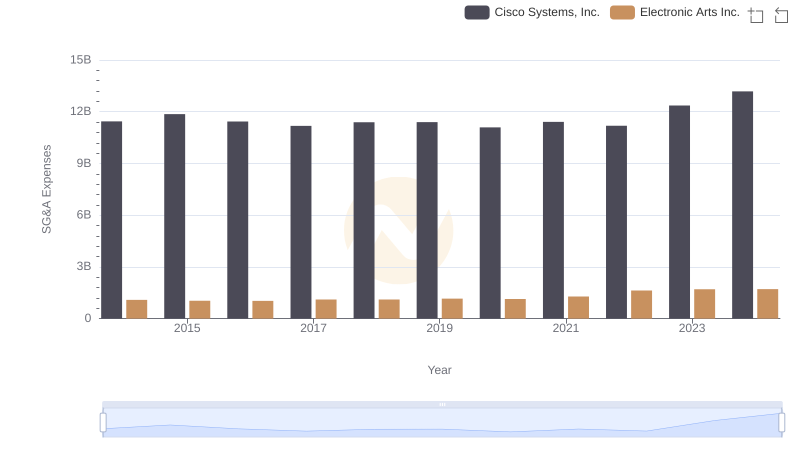
Who Optimizes SG&A Costs Better? Cisco Systems, Inc. or Electronic Arts Inc.
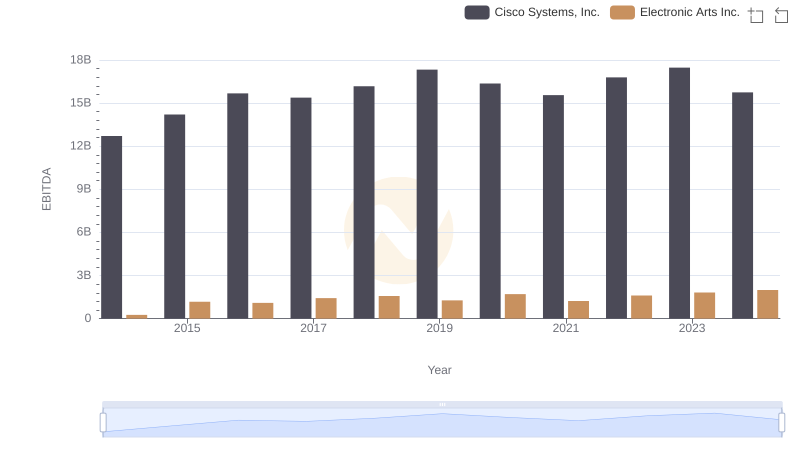
Professional EBITDA Benchmarking: Cisco Systems, Inc. vs Electronic Arts Inc.