| __timestamp | China Eastern Airlines Corporation Limited | Waste Management, Inc. |
|---|---|---|
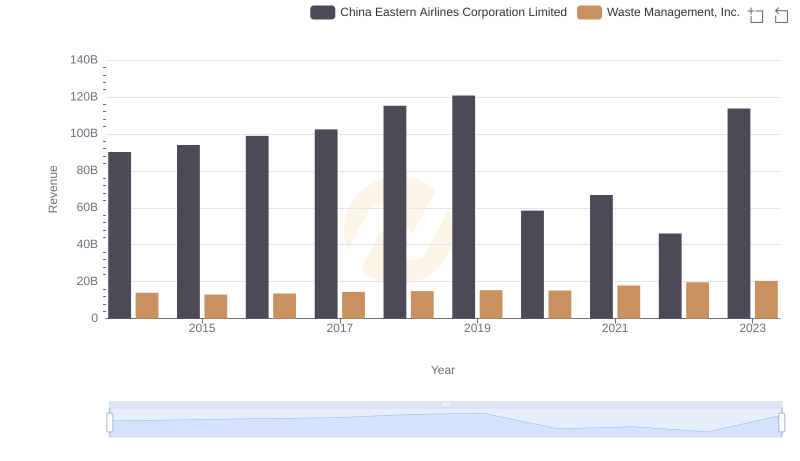
| Wednesday, January 1, 2014 | 78741000000 | 9002000000 |
| Thursday, January 1, 2015 | 77237000000 | 8231000000 |
| Friday, January 1, 2016 | 82676000000 | 8486000000 |
| Sunday, January 1, 2017 | 91592000000 | 9021000000 |
| Monday, January 1, 2018 | 103476000000 | 9249000000 |
| Tuesday, January 1, 2019 | 108865000000 | 9496000000 |
| Wednesday, January 1, 2020 | 72523000000 | 9341000000 |
| Friday, January 1, 2021 | 81828000000 | 11111000000 |
| Saturday, January 1, 2022 | 74599000000 | 12294000000 |
| Sunday, January 1, 2023 | 112461000000 | 12606000000 |
| Monday, January 1, 2024 | 13383000000 |
Unveiling the hidden dimensions of data
In the ever-evolving landscape of global business, understanding the cost of revenue is crucial for evaluating a company's financial health. This analysis delves into the cost of revenue trends for two industry giants: Waste Management, Inc. and China Eastern Airlines Corporation Limited, from 2014 to 2023.
Over the past decade, China Eastern Airlines has experienced significant fluctuations in its cost of revenue, peaking in 2023 with a 55% increase from its lowest point in 2020. This volatility reflects the airline industry's sensitivity to global economic shifts and operational challenges.
Conversely, Waste Management, Inc. has shown a more stable trajectory, with a steady increase of approximately 40% over the same period. This stability underscores the resilience of the waste management sector, even amidst economic uncertainties.
These insights highlight the contrasting dynamics of these two sectors, offering valuable lessons for investors and industry analysts alike.
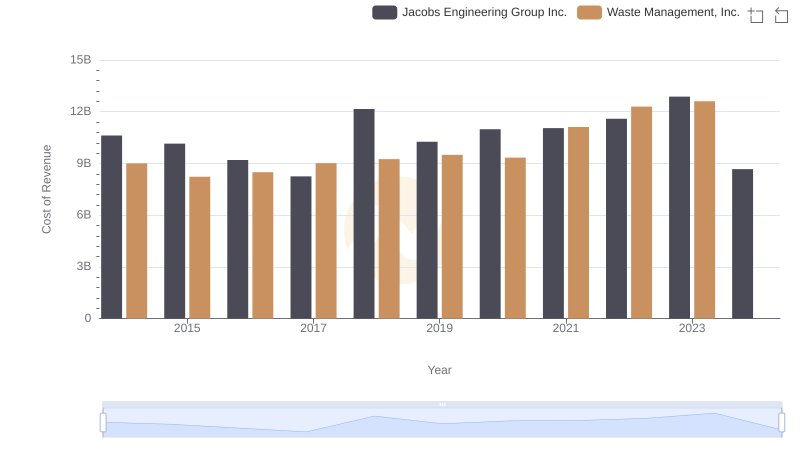
Cost of Revenue: Key Insights for Waste Management, Inc. and Jacobs Engineering Group Inc.
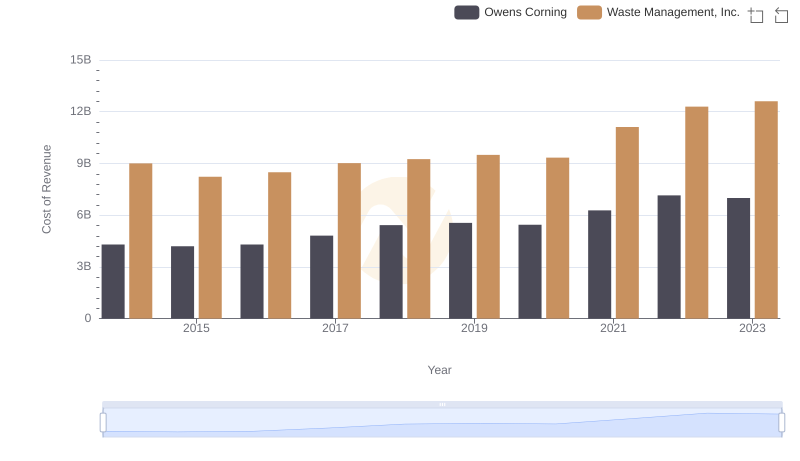
Comparing Cost of Revenue Efficiency: Waste Management, Inc. vs Owens Corning
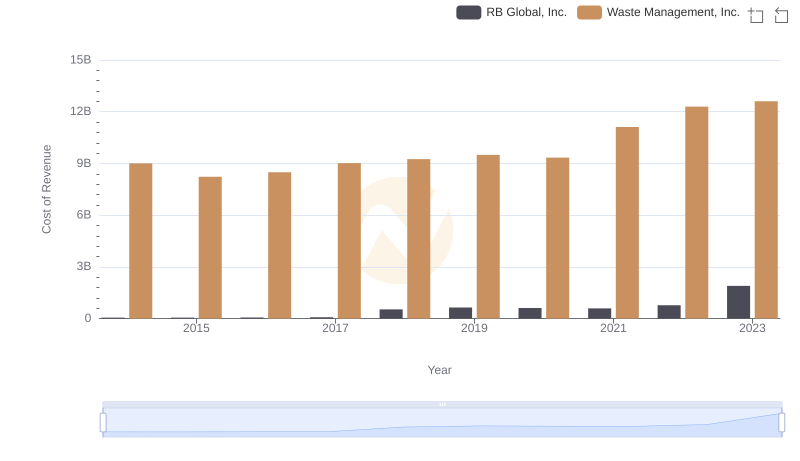
Cost of Revenue: Key Insights for Waste Management, Inc. and RB Global, Inc.
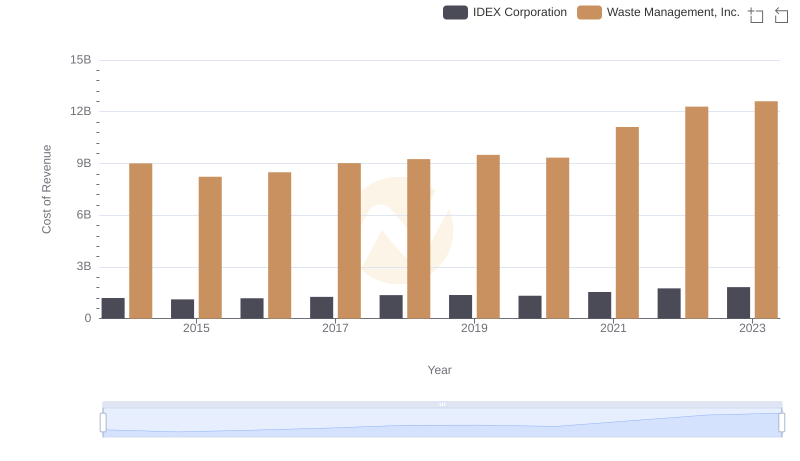
Comparing Cost of Revenue Efficiency: Waste Management, Inc. vs IDEX Corporation
Waste Management, Inc. vs China Eastern Airlines Corporation Limited: Annual Revenue Growth Compared
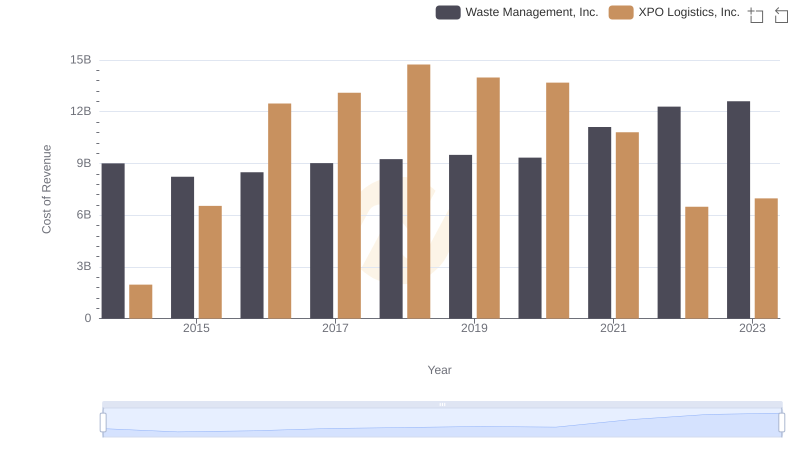
Cost of Revenue: Key Insights for Waste Management, Inc. and XPO Logistics, Inc.
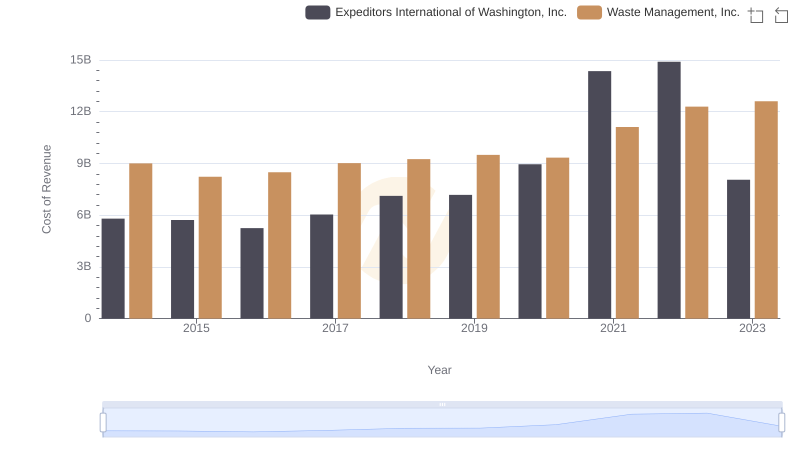
Waste Management, Inc. vs Expeditors International of Washington, Inc.: Efficiency in Cost of Revenue Explored
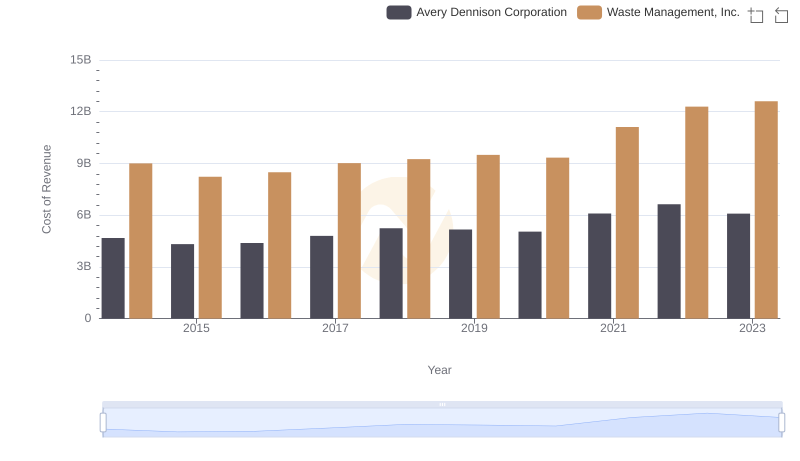
Cost Insights: Breaking Down Waste Management, Inc. and Avery Dennison Corporation's Expenses
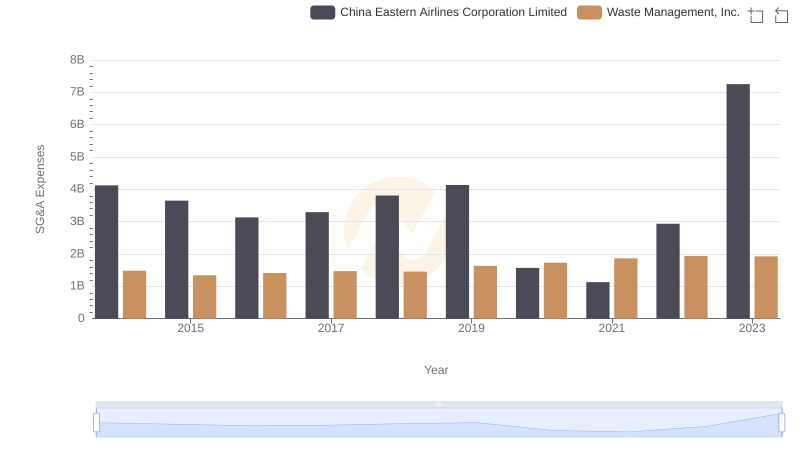
Selling, General, and Administrative Costs: Waste Management, Inc. vs China Eastern Airlines Corporation Limited
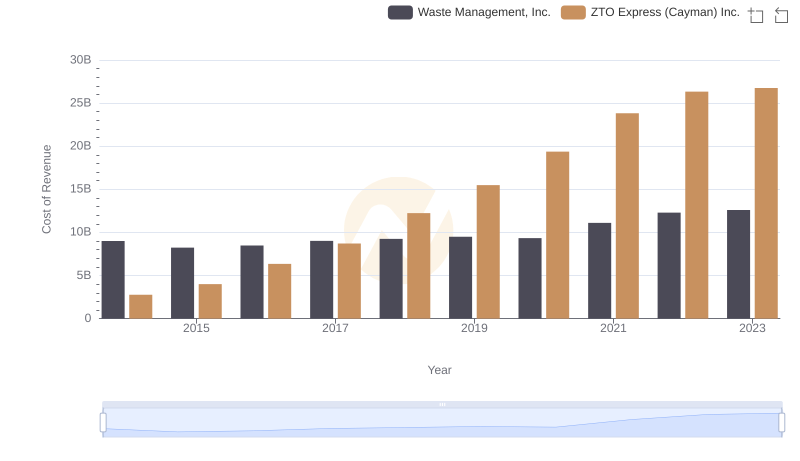
Analyzing Cost of Revenue: Waste Management, Inc. and ZTO Express (Cayman) Inc.
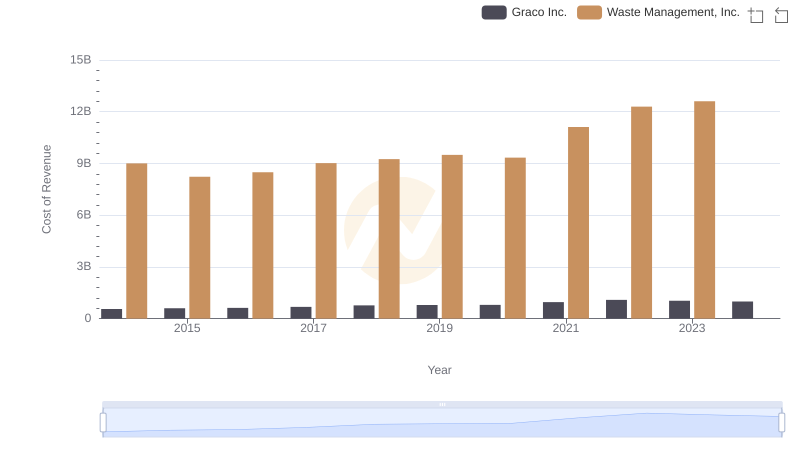
Cost Insights: Breaking Down Waste Management, Inc. and Graco Inc.'s Expenses