| __timestamp | United Airlines Holdings, Inc. | Waste Connections, Inc. |
|---|---|---|
| Wednesday, January 1, 2014 | 29569000000 | 1138388000 |
| Thursday, January 1, 2015 | 25952000000 | 1177409000 |
| Friday, January 1, 2016 | 24856000000 | 1957712000 |
| Sunday, January 1, 2017 | 27056000000 | 2704775000 |
| Monday, January 1, 2018 | 30165000000 | 2865704000 |
| Tuesday, January 1, 2019 | 30786000000 | 3198757000 |
| Wednesday, January 1, 2020 | 20385000000 | 3276808000 |
| Friday, January 1, 2021 | 23913000000 | 3654074000 |
| Saturday, January 1, 2022 | 34315000000 | 4336012000 |
| Sunday, January 1, 2023 | 38518000000 | 4744513000 |
| Monday, January 1, 2024 | 37643000000 | 5191706000 |
Unveiling the hidden dimensions of data
In the ever-evolving landscape of corporate finance, the cost of revenue serves as a critical indicator of a company's operational efficiency. This comparison between Waste Connections, Inc. and United Airlines Holdings, Inc. offers a fascinating glimpse into two distinct sectors: waste management and aviation.
From 2014 to 2023, United Airlines Holdings, Inc. experienced a 30% increase in its cost of revenue, peaking in 2023. This reflects the airline industry's volatile nature, influenced by fluctuating fuel prices and global travel demand. In contrast, Waste Connections, Inc. saw a steady rise of over 300% in the same period, highlighting the growing importance of sustainable waste management solutions.
While United Airlines' cost of revenue fluctuated, Waste Connections demonstrated consistent growth, underscoring the resilience of essential services. This comparison not only highlights industry-specific challenges but also the broader economic trends shaping these sectors.
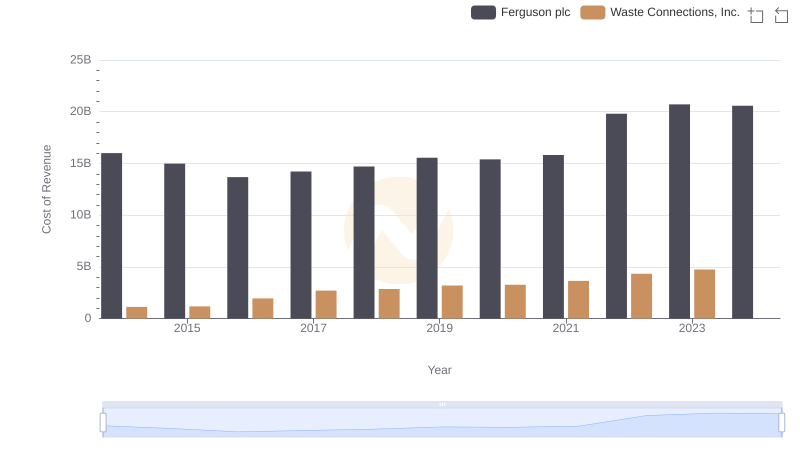
Cost of Revenue Comparison: Waste Connections, Inc. vs Ferguson plc
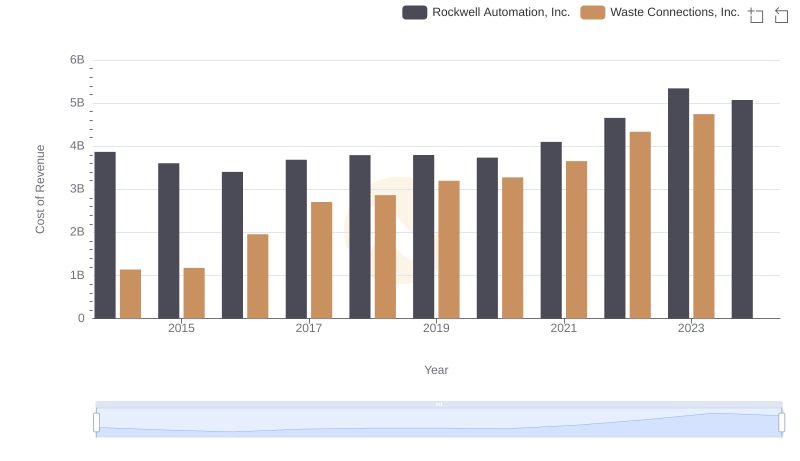
Cost of Revenue: Key Insights for Waste Connections, Inc. and Rockwell Automation, Inc.
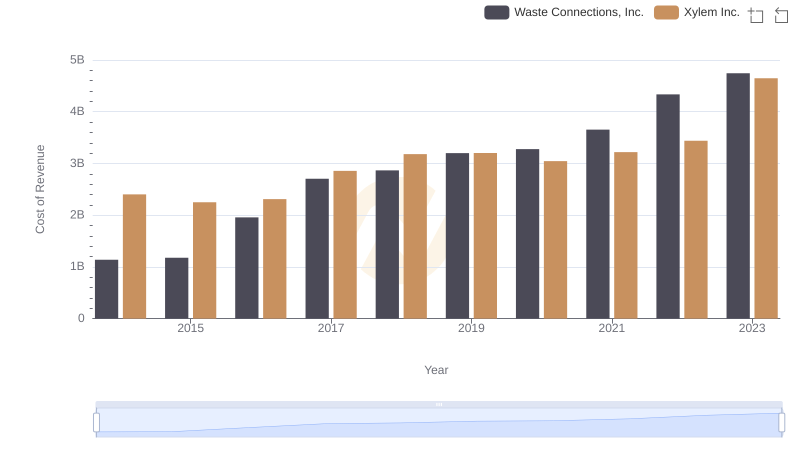
Cost of Revenue: Key Insights for Waste Connections, Inc. and Xylem Inc.
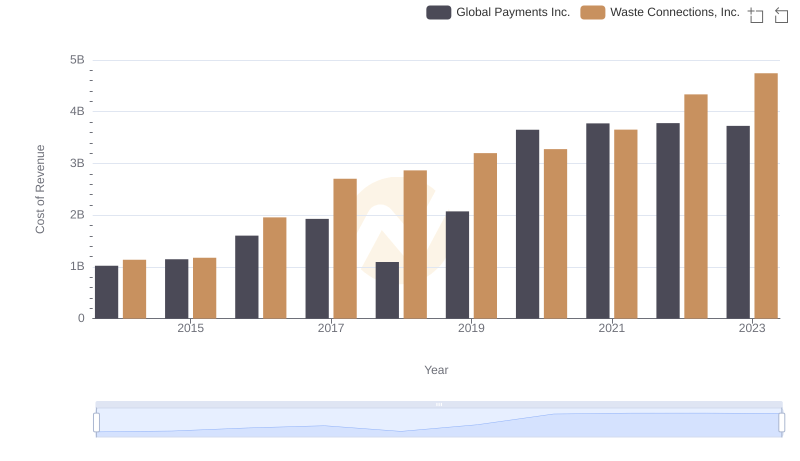
Cost Insights: Breaking Down Waste Connections, Inc. and Global Payments Inc.'s Expenses