| __timestamp | Intuit Inc. | Take-Two Interactive Software, Inc. |
|---|---|---|
| Wednesday, January 1, 2014 | 668000000 | 1414327000 |
| Thursday, January 1, 2015 | 725000000 | 794867000 |
| Friday, January 1, 2016 | 752000000 | 813873000 |
| Sunday, January 1, 2017 | 809000000 | 1022959000 |
| Monday, January 1, 2018 | 977000000 | 898311000 |
| Tuesday, January 1, 2019 | 1167000000 | 1523644000 |
| Wednesday, January 1, 2020 | 1378000000 | 1542450000 |
| Friday, January 1, 2021 | 1683000000 | 1535085000 |
| Saturday, January 1, 2022 | 2406000000 | 1535401000 |
| Sunday, January 1, 2023 | 3143000000 | 3064600000 |
| Monday, January 1, 2024 | 3465000000 | 3107800000 |
Unveiling the hidden dimensions of data
In the ever-evolving landscape of software development, understanding the cost of revenue is crucial for assessing a company's financial health. This analysis focuses on Intuit Inc. and Take-Two Interactive Software, Inc., two giants in the industry. Over the past decade, Intuit's cost of revenue has surged by over 400%, from approximately $680 million in 2014 to an estimated $3.47 billion in 2024. Meanwhile, Take-Two Interactive has seen a more modest increase of around 120%, reaching $3.11 billion in 2024 from $1.41 billion in 2014.
Intuit's aggressive growth strategy is evident in its rising costs, reflecting its expanding market presence and product offerings. In contrast, Take-Two's steady increase suggests a more conservative approach, focusing on sustainable growth. These trends highlight the diverse strategies employed by leading software companies to navigate the competitive landscape.
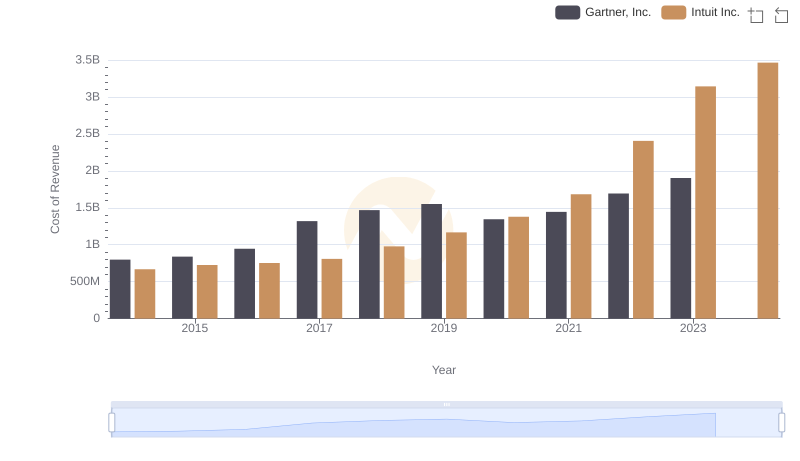
Intuit Inc. vs Gartner, Inc.: Efficiency in Cost of Revenue Explored
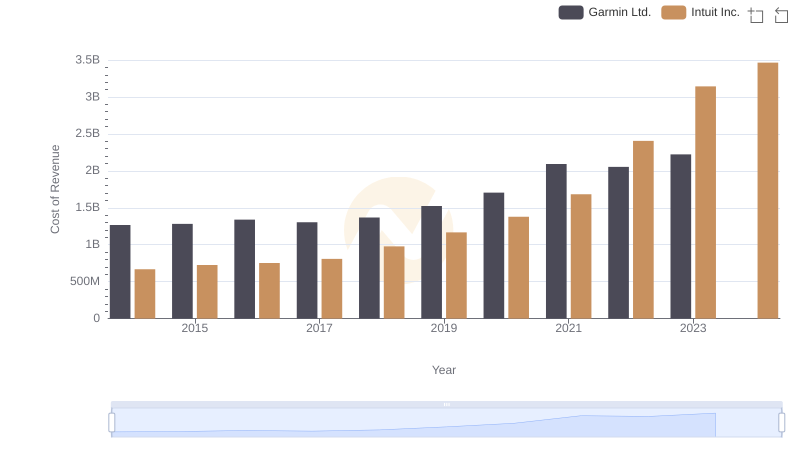
Cost of Revenue Comparison: Intuit Inc. vs Garmin Ltd.
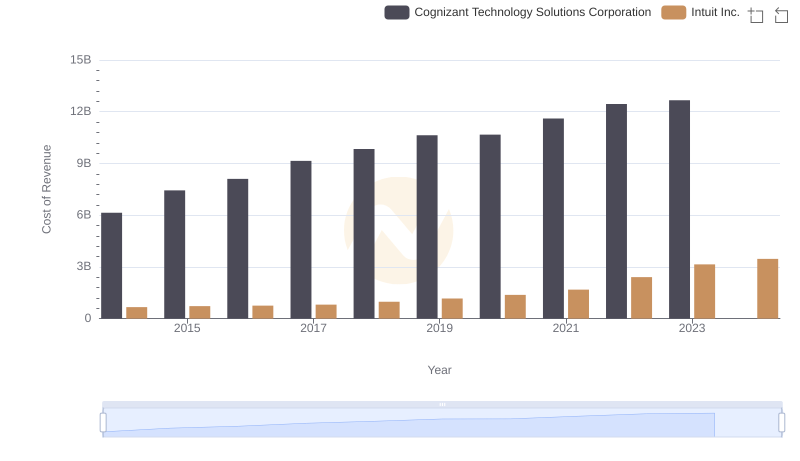
Cost Insights: Breaking Down Intuit Inc. and Cognizant Technology Solutions Corporation's Expenses
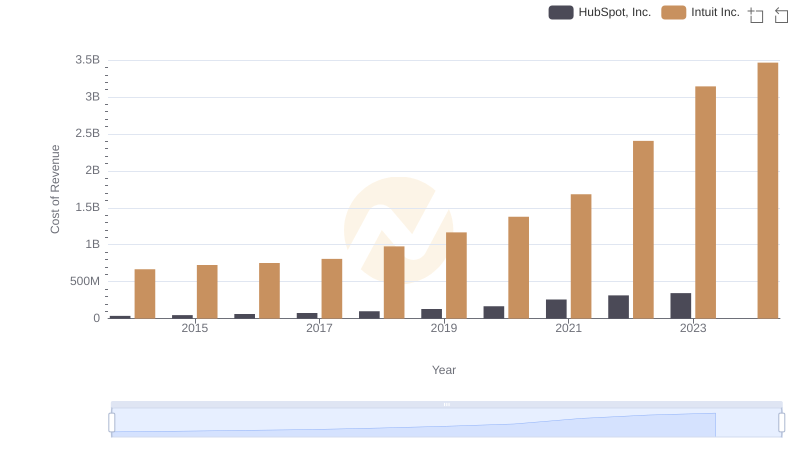
Comparing Cost of Revenue Efficiency: Intuit Inc. vs HubSpot, Inc.
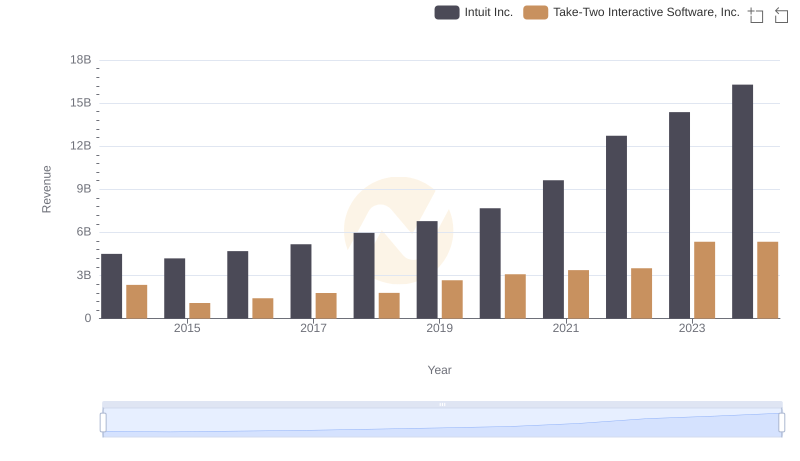
Intuit Inc. and Take-Two Interactive Software, Inc.: A Comprehensive Revenue Analysis
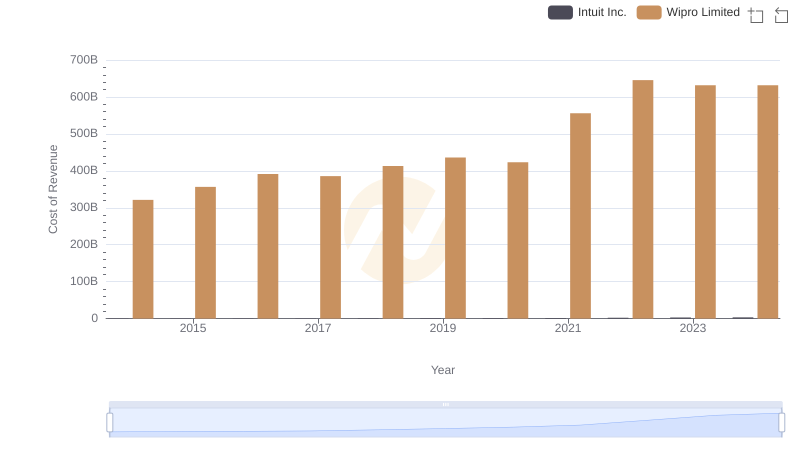
Cost of Revenue: Key Insights for Intuit Inc. and Wipro Limited
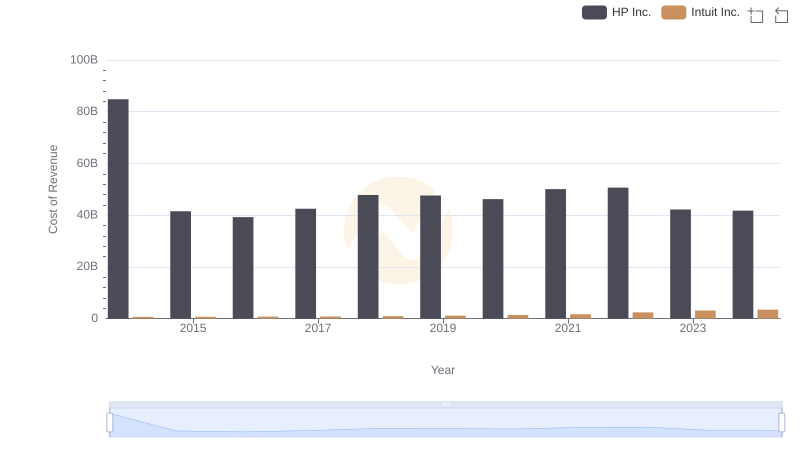
Cost of Revenue Trends: Intuit Inc. vs HP Inc.
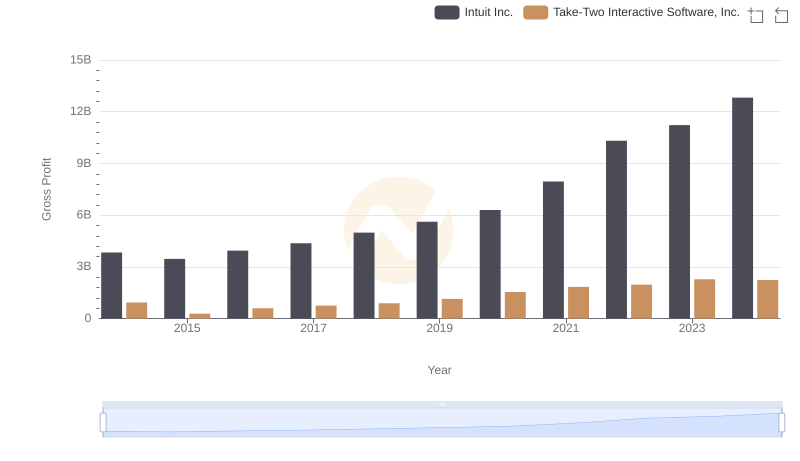
Intuit Inc. and Take-Two Interactive Software, Inc.: A Detailed Gross Profit Analysis
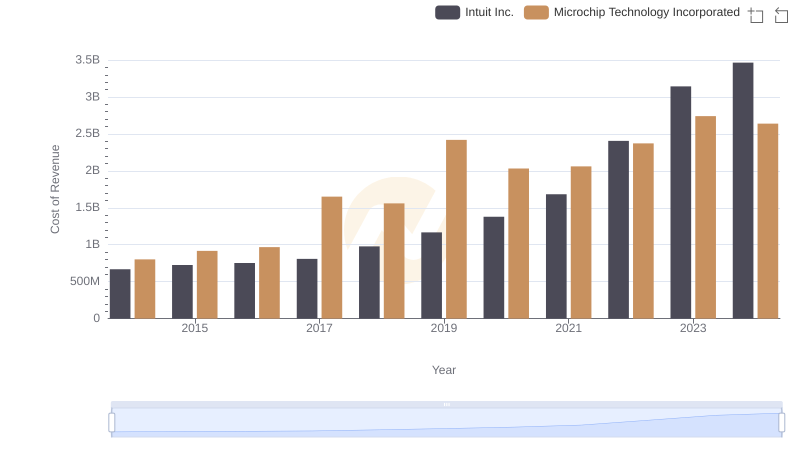
Cost of Revenue Trends: Intuit Inc. vs Microchip Technology Incorporated
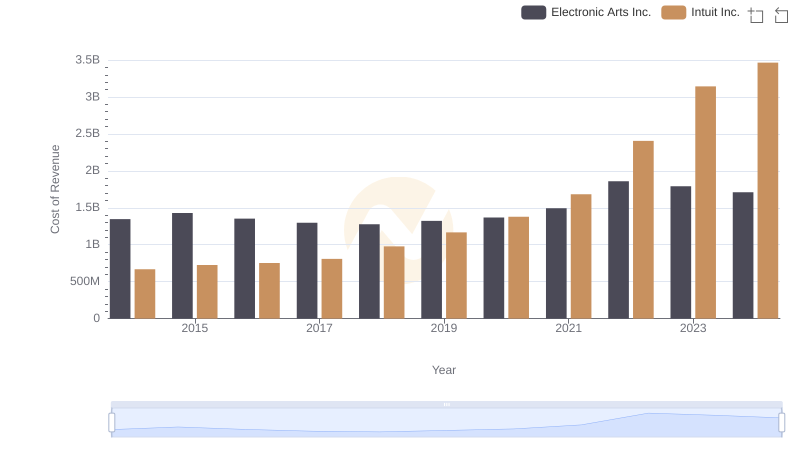
Cost Insights: Breaking Down Intuit Inc. and Electronic Arts Inc.'s Expenses
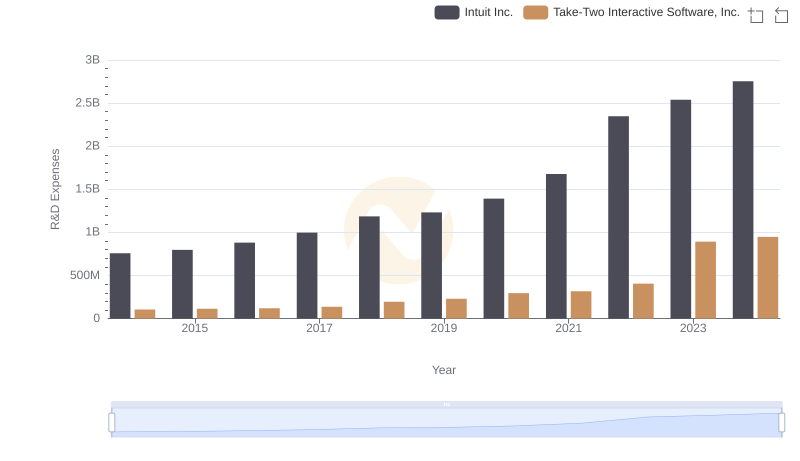
Analyzing R&D Budgets: Intuit Inc. vs Take-Two Interactive Software, Inc.
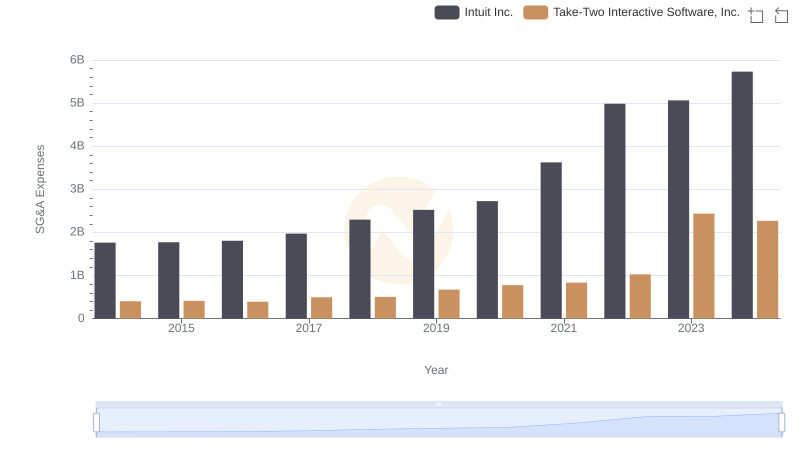
Comparing SG&A Expenses: Intuit Inc. vs Take-Two Interactive Software, Inc. Trends and Insights