| __timestamp | CSX Corporation | Nordson Corporation |
|---|---|---|
| Wednesday, January 1, 2014 | 9056000000 | 758923000 |
| Thursday, January 1, 2015 | 8227000000 | 774702000 |
| Friday, January 1, 2016 | 7680000000 | 815495000 |
| Sunday, January 1, 2017 | 7635000000 | 927981000 |
| Monday, January 1, 2018 | 7477000000 | 1018703000 |
| Tuesday, January 1, 2019 | 7063000000 | 1002123000 |
| Wednesday, January 1, 2020 | 6221000000 | 990632000 |
| Friday, January 1, 2021 | 7382000000 | 1038129000 |
| Saturday, January 1, 2022 | 9068000000 | 1163742000 |
| Sunday, January 1, 2023 | 9130000000 | 1203227000 |
| Monday, January 1, 2024 | 1203792000 |
Data in motion
In the ever-evolving landscape of corporate finance, understanding cost structures is pivotal. This analysis delves into the cost of revenue trends for CSX Corporation and Nordson Corporation from 2014 to 2023. Over this decade, CSX Corporation's cost of revenue fluctuated, peaking in 2023 with a 47% increase from its lowest point in 2020. Meanwhile, Nordson Corporation exhibited a steady upward trajectory, culminating in a 58% rise by 2023 compared to 2014. Notably, CSX's costs dipped significantly in 2020, reflecting potential strategic shifts or market conditions. In contrast, Nordson's consistent growth underscores its robust operational strategies. This comparative insight not only highlights the dynamic nature of these corporations but also offers a window into their strategic financial maneuvers over the years.
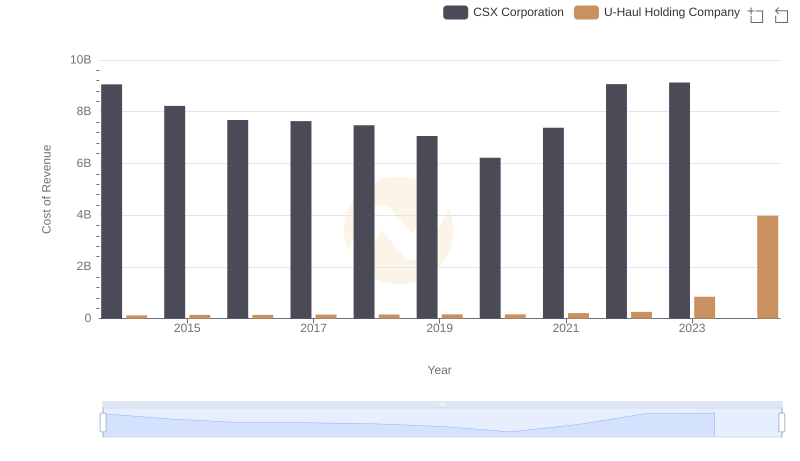
Cost Insights: Breaking Down CSX Corporation and U-Haul Holding Company's Expenses
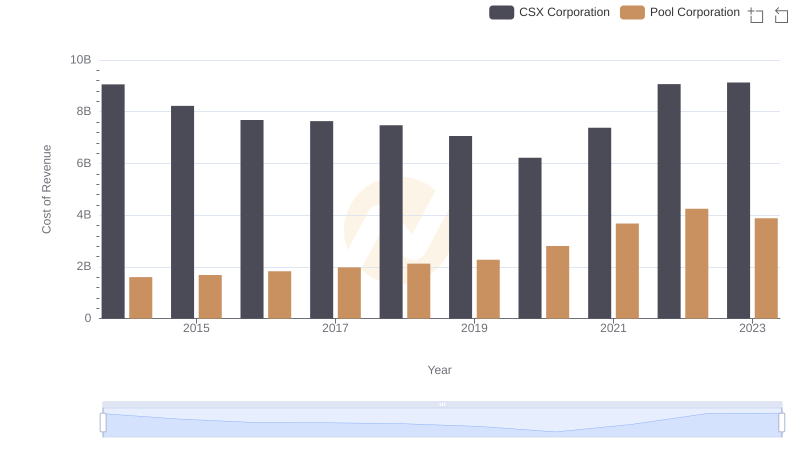
Comparing Cost of Revenue Efficiency: CSX Corporation vs Pool Corporation
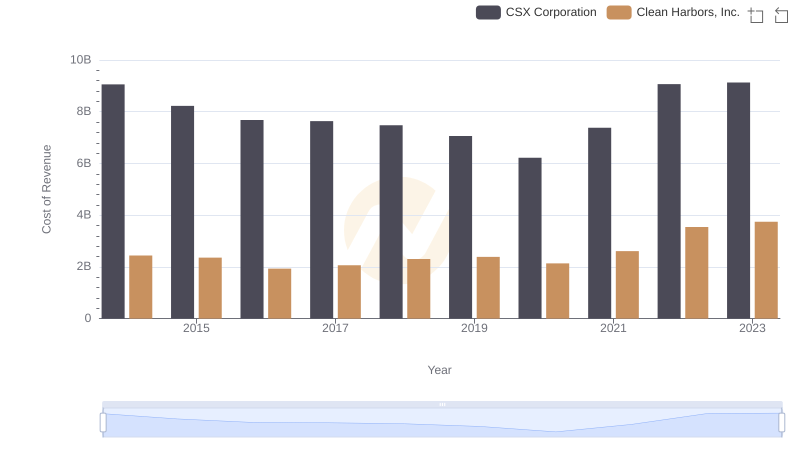
Cost of Revenue Comparison: CSX Corporation vs Clean Harbors, Inc.
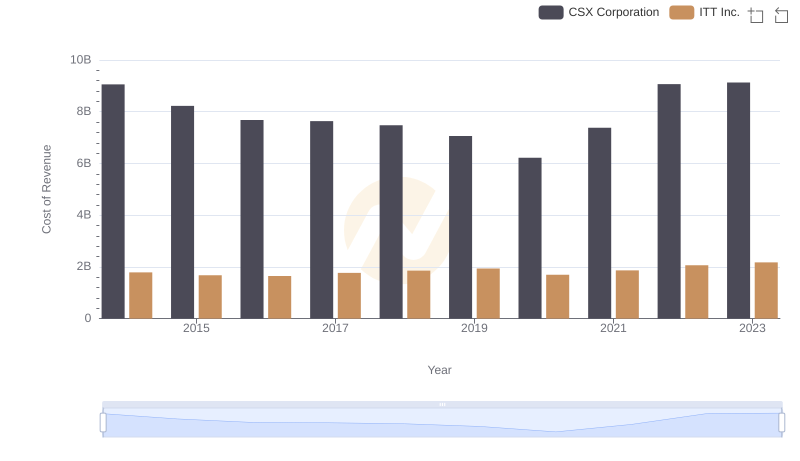
Cost of Revenue: Key Insights for CSX Corporation and ITT Inc.
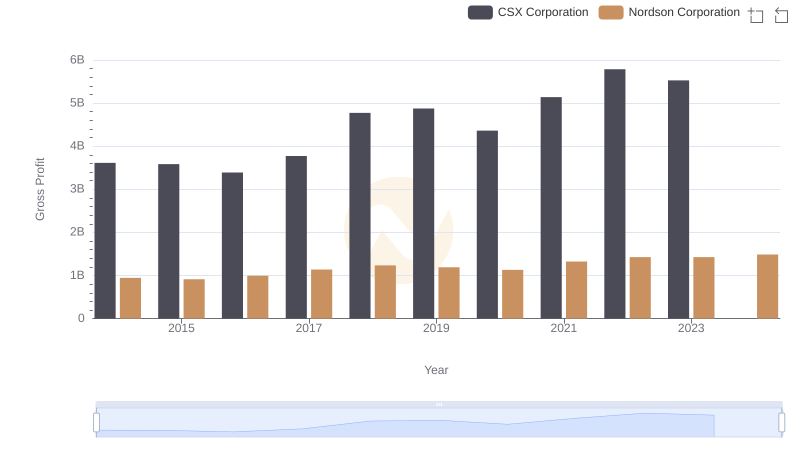
Gross Profit Trends Compared: CSX Corporation vs Nordson Corporation
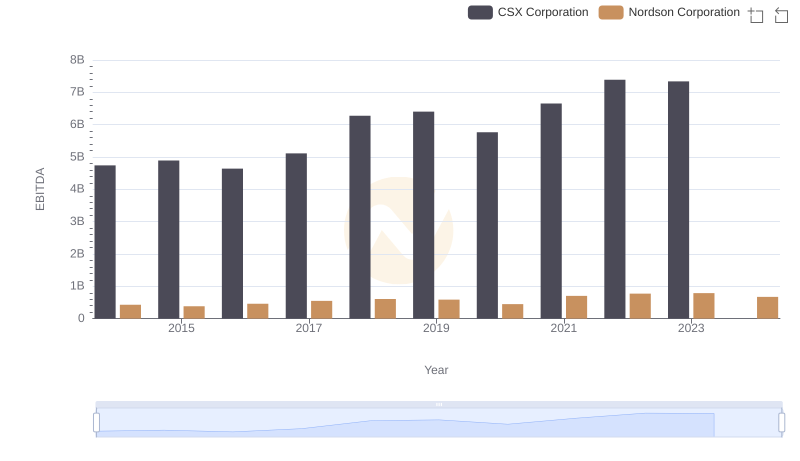
A Professional Review of EBITDA: CSX Corporation Compared to Nordson Corporation